Prices Forecast: Technical Analysis
For today, the predicted closing price for USD/INR is 95.50, with a range of 95.00 to 96.00. Looking ahead to the week, the forecasted closing price is 96.00, with a range of 95.50 to 96.50. The Relative Strength Index (RSI) currently sits at 62.87, indicating a bullish trend, while the Average True Range (ATR) of 0.8175 suggests moderate volatility. The market sentiment appears positive, supported by the recent upward price movements. The price has been consistently above the 50-day SMA, which is a bullish signal. However, the lack of clear resistance levels may lead to fluctuations. Overall, the technical indicators suggest a potential for further gains, but traders should remain cautious of any sudden market shifts.
Fundamental Overview and Analysis
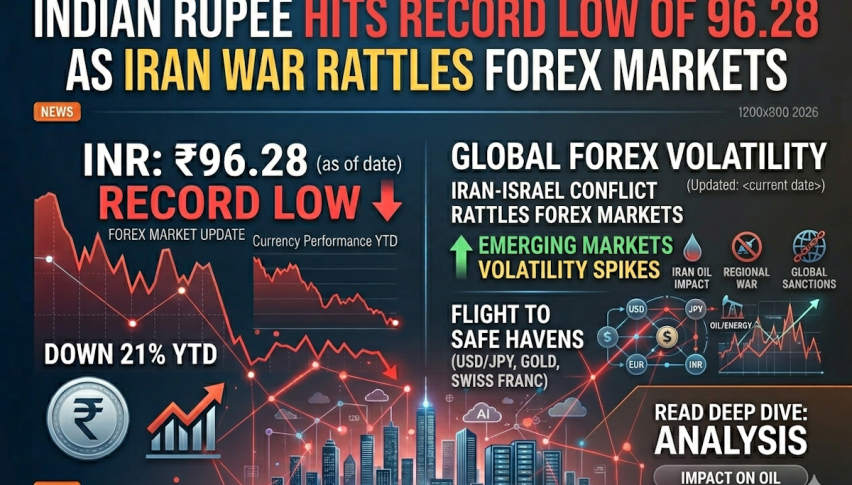
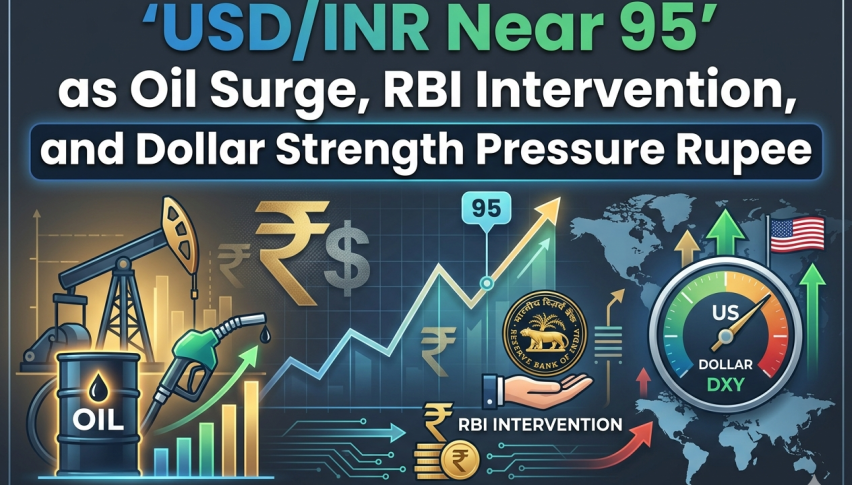
The USD/INR has shown a steady upward trend recently, influenced by various macroeconomic factors. The demand for USD has been strong due to ongoing economic recovery in the U.S., while the Indian economy faces challenges such as inflation and trade deficits. Investor sentiment remains cautiously optimistic, with many viewing the USD as a safe haven. However, the Indian Rupee’s performance is also affected by global oil prices and geopolitical tensions. Opportunities for growth exist, particularly if India can stabilize its economy and attract foreign investment. Conversely, risks include potential regulatory changes and market volatility that could impact investor confidence. Currently, the USD/INR appears to be fairly valued, but fluctuations in economic indicators could alter this perception.
Outlook for USD/INR
The future outlook for USD/INR remains cautiously optimistic, with potential for continued upward movement in the short term. Current market trends indicate a bullish sentiment, supported by historical price movements and recent economic data. In the next 1 to 6 months, we could see the USD/INR trading between 95.00 and 97.00, depending on economic conditions and market sentiment. Long-term forecasts suggest that if the U.S. economy continues to strengthen, the USD may appreciate further against the INR. However, external factors such as geopolitical tensions and global economic shifts could significantly impact this trajectory. Investors should keep an eye on inflation rates and central bank policies, as these will be crucial in determining the future price movements of USD/INR.
Technical Analysis
Current Price Overview: The current price of USD/INR is nan. Compared to the previous close, the price has shown a slight upward movement over the last 24 hours, indicating bullish momentum. Notable price patterns suggest a potential continuation of this trend. Support and Resistance Levels: The identified support levels are 94.00, 93.50, and 93.00, while resistance levels are 96.00, 96.50, and 97.00. The pivot point is currently unavailable, indicating uncertainty in market direction. Technical Indicators Analysis: The RSI at 62.87 suggests a bullish trend, while the ATR of 0.8175 indicates moderate volatility. The ADX is at 24.51, showing a strengthening trend. The 50-day SMA is above the 200-day EMA, confirming a bullish crossover. Market Sentiment & Outlook: Sentiment is currently bullish, supported by price action above the pivot and positive RSI and ADX trends.
Forecasting Returns: $1,000 Across Market Conditions
The table below outlines potential investment scenarios for USD/INR, providing insights into expected returns based on different market conditions. Investors should consider these scenarios when deciding on their investment strategies.
| Scenario | Price Change | Value After 1 Month |
|---|---|---|
| Bullish Breakout | +5% to ~$1000 | ~$1,050 |
| Sideways Range | 0% to ~$0 | ~$1,000 |
| Bearish Dip | -5% to ~$950 | ~$950 |
FAQs
What are the predicted price forecasts for the asset?
The predicted daily closing price for USD/INR is 95.50, with a weekly forecast of 96.00. The price is expected to range between 95.00 to 96.00 today and 95.50 to 96.50 for the week.
What are the key support and resistance levels for the asset?
Key support levels for USD/INR are 94.00, 93.50, and 93.00, while resistance levels are 96.00, 96.50, and 97.00. These levels will be crucial for traders to monitor for potential price movements.
What are the main factors influencing the asset’s price?
The main factors influencing USD/INR include economic recovery in the U.S., inflation rates in India, and global oil prices. Additionally, geopolitical tensions can also impact investor sentiment and currency value.
What is the outlook for the asset in the next 1 to 6 months?
The outlook for USD/INR in the next 1 to 6 months is cautiously optimistic, with potential trading between 95.00 and 97.00. Economic conditions and market sentiment will play significant roles in determining price movements.
What are the risks and challenges facing the asset?
Risks facing USD/INR include potential regulatory changes, market volatility, and geopolitical tensions. These factors could significantly impact investor confidence and currency performance.
Disclaimer
In conclusion, while the analysis provides a structured outlook on the asset’s potential price movements, it is essential to remember that financial markets are inherently unpredictable. Conducting thorough research and staying informed about market trends and economic indicators is crucial for making informed investment decisions.