
USD/JPY Price Forecast for 2021: Symmetrical Triangle Setup – Which Side It’s Going to Breakout?


Last Update: December 18th, 2023


USD/JPY – Forecast Summary
| USD/JPY Forecast: H1 2021 Price: $112 – $115 Price drivers: COVID-19 measures in Japan, US Treasuries, Successful U.S vaccination campaigns, Technicals | USD/JPY Forecast: 1 Year Price: $115 – $120 Price drivers: Slow Economic Rebound in Japan, Economic growth in US, Global Tensions | USD/JPY Forecast: 3 Years Price: $110 – $120 Price drivers: Bank of Japan Monetary Policy, Federal Reserve Monetary policy, Geopolitical Tensions |
The USD/JPY was trading with a bullish trend since December 2020 after being bearish since 2017. A year ago, the price was trading around 102-103, and now it is trading higher around 110-111. The USD/JPY pair has started this year on a positive note as it has been rising from January and continuously placing small gains since then on the back of the recent strengthening U.S. dollar during Q1 and improved sentiment since early spring. Overall, this pair has a bullish bias and if the economic and virus situation doesn’t change too much from the last 5-6 months, then chances are that USD/JPY will continue this year’s bullish tren higher.
Both currencies involved in the exchange rate of the USD/JPY pair are some of the most traded currencies in the world. They are known for their status as safe-haven assets that tend to allow investors to profit from the currency pair during risk-sentiment in the market. The U.S. dollar is a global reserve currency, while the yen is used as a reserve currency in Asia. The Japanese yen has been historically used as a safe-haven asset by traders and investors due to the stable economic policy of Japan. The country holds the world’s largest reserve of foreign investment assets and has become the major funding currency. Due to a prolonged period of low interest rates in Japan, the traders and investors tend to borrow funds in yen to finance investments in the higher-yielding countries, commonly known as a carry trade. However, in the past year, carry trade has become less attractive due to record low interest rates in other countries amid the coronavirus pandemic.
76% of retail investor accounts lose money when trading CFDs with this provider. You should consider whether you can afford to take the high risk of losing your money.
Recent Changes in the USD/JPY Price
| Period | Change ($) | Change % |
| 30 Days | -0.61 | >-1% |
| 3 Months | +1.70 | +1.6% |
| 6 Months | +6.06 | +5.8% |
| 1 Year | +5.12 | +4.6% |
| 3 Years | -2.20 | -1.9% |
USD/JPY Price Prediction for the Next 5 Years
Since the beginning of 2021, the currency pair USD/JPY has been mainly positive after reversing from its the 3-year bearish momentum. The currency pair was declining continuously since January 2017. It saw a little positive correction from April 2018 to September 2018, but after that, the bearish momentum only gathered speed and increased its losses till the end of the previous year. In 2020, the currency pair lost almost $10 after placing a high of $112 in February and a low of $102 in December. However, USD/JPY started this year on a positive note, and in just three months, USD/JPY has reached $110, where it has mostly been hanging around. It means the bullish momentum across the currency pair is strong as almost 80% of the previous year’s loss has been recovered in the first quarter of this year. Nonetheless, the currency pair has started stagnating since April, amid the renewed weakness in the US dollar in Q2.
The rising US Treasury yields drove the reversal in USD/JPY as this exchange rate is closely correlated with the treasuries. The recent spike in US Treasury yields supported the greenback that ultimately lifted the USD/JPY pair. The pair is also known as a riskier asset and tends to decline during the increased safe-haven appeal. In April, the risk-off market sentiment driven by the surging geopolitical tensions between the US & China and the US & Russia increased concerns about global economic recovery, weighing on the USD/JPY pair.
The increased demand for a safe-haven asset like the Japanese yen against the US dollar tends to drive the USD/JPY pair lower during risk-off market sentiment. The growth projections from the International Monetary Fund (IMF) for both countries for 2021 and 2022 have improved. According to the latest growth projections from the IMF, the United States’ economy is expected to grow by 5.1% in 2021 and 3.6% in 2022 after contracting -4.7% in 2020. At the same time, the economy of Japan is expected to grow by 3.3% in 2021 and 2.5% in 2022 against a 4.8% contraction in 2020.
Given the projections provided by IMF, the outlook of the US economy for years to come looks more promising than Japan’s economic outlook. This means that the US dollar will remain stronger against the Japanese Yen in coming years, and the USD/JPY pair will remain bullish in the long run. Other than economic outlook, the factors like US Treasuries, risk-sentiment, inflation, monetary policy, manufacturing activity, employment rates, government policy, GDP, coronavirus pandemic, and vaccination campaigns will also influence the movements of USD/JPY pair in the short-term as well as in long-term.
Factors Affecting USD/JPY
Virus Emergency in Japan – On the 25th April 2021, the Japanese government imposed emergency Covid measures in Tokyo and three other areas to control the rising number of infections, three months ahead of the Olympics. It was the third state of emergency in Japan since the pandemic began.
The latest Delta variant has been in Japan alreay and they are reinforcing the measures again, despite the Olympic Games. Under these measures, restaurants and other businesses were closed, and the strictest rules were applied to stop the rising number of infection cases. Japan saw a hike in new cases and hospitalizations nationwide that was soaring toward record highs.
Furthermore, the Japanese health officials were concerned about the rapid spread of the virus due to the the new variant of the virus and. The health ministry of Japan has only authorized one vaccine made by Pfizer/BioNTech in mid-February. This has put the country well behind its peers in the effort to administer vaccine doses to protect against COVID-19.
Being an advanced country, Japan was far behind its peers in the rollout of vaccine doses and the fourth wave of coronavirus has forced the government to impose a third state of emergency, and kept the Japanese economic outlook under pressure ahead of the Olympics. These concerns hold a negative impression over the Japanese Yen and portray a declining demand that could drive the USD/JPY pair higher in the short-term and long-term.
Vaccination Campaigns in the U.S.: The vaccination campaigns in the United States have been working successfully as the goal of administering more than 200 million vaccine doses to Americans by Joe Biden was achieved 8 days ahead of schedule. Originally, Joe Biden has set 100 million vaccine shots in arms during the first 100 days of his presidency. But after reaching the goal in 58 days, a second goal was set to administer 200 million shots within the first 100 days. More than 50% of Americans have had at least 1 shot of the vaccine, and more than 80% of old-age Americans have had at least one shot. According to the Centers for Disease Control and Prevention (CDC) data tracker, the US received 272,030,795 coronavirus vaccine doses out of which 213,388,238 have been administered and about 86,223,506 Americans were fully vaccinated.
There were also concerns that the US might have more vaccines than people who want them by mid-May. The average number of coronavirus vaccinations administered in the US per day has been falling recently. The military saw a surplus dose and a steady decline in the rate at which they are used. It has led to the closure of some US vaccination sites due to a drop in demand for the vaccine.
Given this situation, the US has now started to receive calls for sharing the surplus vaccine doses with other countries. It has also faced criticism that it was only hoarding its stockpiles and blocking other countries from accessing vaccines. The successful vaccination campaign in the US improved its economic outlook against Japan which was far behind in rolling out of COVID-19 vaccines. This improved outlook for the US economy portrays strength in the US dollar against the Japanese Yen that will help the USD/JPY pair to remain on the bullish track in the coming months.
Japan Monetary Policy – In its latest monetary policy meeting, KURODA Haruhiko, the Bank of Japan Goveror kept the monetary stance unchanged against a backdrop of mild price pressures.The BoJ left the short-term policy rate fixed at -0.10% and continued to maintain the COVID-19 motivated upper limits for purchases of ETFs and Japan real estate investment trusts (J-REITs) at JPY 12 trillion and JPY 180 billion, respectively. The Bank has reiterated its dovish tone and stated that it will closely monitor the impact of coronavirus and will not hesitate to take additional easing measures if needed. The bank also expects the short-term and long-term interest rates to remain at a lower level and unchanged through 2022. The dovish stance of BoJ might continue to weigh on the Japanese yen and support the USD/JPY pair throughout this year and the next year.
Risk-Off Market Sentiment – The rising risk-off market sentiment could disturb the USD/JPY increasing prices in the near term. The increasing tensions between China and the United States along with the U.S. and Russia could reverse the sentiment around the market. Although both currencies involved in the USD/JPY currency pair are safe-haven currencies, still the impact of risk-off market sentiment tends to push Yen higher than the US dollar and weigh on the USD/JPY pair. Lately, the United States, with the coordination of the European Union, Canada, and the United Kingdom, enforced sanctions on Chinese officials for violating human rights in Xinjiang Province. On the other hand, China has dismissed these accusations and has imposed even harder sanctions on European, US, and Canadian lawmakers in retaliation.
These rising tensions between China and western countries could lead to another round of global tensions that could raise the safe-haven appeal in the market and support the Japanese Yen currency that will eventually drag USD/JPY on the downside. Furthermore, the tensions between the US and China over the Taiwan issue and the Tech war have also seen improvements lately that could raise the tensions between the world’s largest economies and could lift the risk-off market sentiment. The USD/JPY currency pair could see bearish pressure in the short-term and in the long-term if geopolitical tensions continue to rise in the world.
EUR/CHF Price Forecast for 2021: Can It Violate Symmetrical Triangle Pattern on Lower Side?
Monero Coin (XMR) Forecast for 2021: Will the XMR/USD Continue to Rise in 2021?
Technical Analysis – USD/JPY Violates Upward Trendline
The USD/JPY has been trading with a bullish trend since Dec 2020. A year ago, its prices were at 102.597 level, and now it has reached 109.290 level. On the technical front, the pair is holding above monthly 20 and 50 periods EMA support levels of 108.080 and 106.228 levels, respectively. The leading technical indicator, the MACD (Moving average convergence divergence) and RSI (Relative Strength Index), are exhibiting a bullish trend in the currency pair.
On the monthly time-frame, the MACD and RSI have crossed over the mid-level (0 level), and 50 respectively, which exhibits a strong bullish trend in the price. The USD/JPY has closed a series of bullish engulfing and three white soldiers’ pattern on the monthly time-frame. For now, the USD/JPY pair is retracing lower after facing resistance at 110.800 level.
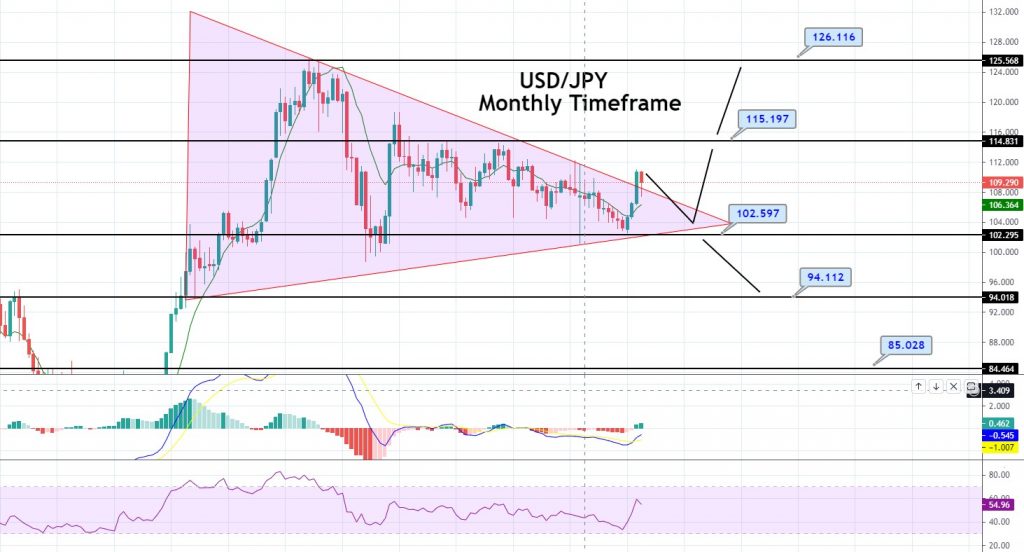
USD/JPY – Monthly Time-frame – Symmetrical Triangle
The USD/JPY has violated a symmetrical triangle pattern on the monthly time-frame that kept it within a wide trading range of 102.590 – 111.250 level. We can also see a downward trendline extending support to the pair around 107.720 level. However, this level’s violation can trigger sharp selling until the next support area of 102.597 level. Conversely, the bullish breakout of the 110.52 level can lead the USD/JPY price towards the 115.197 level.
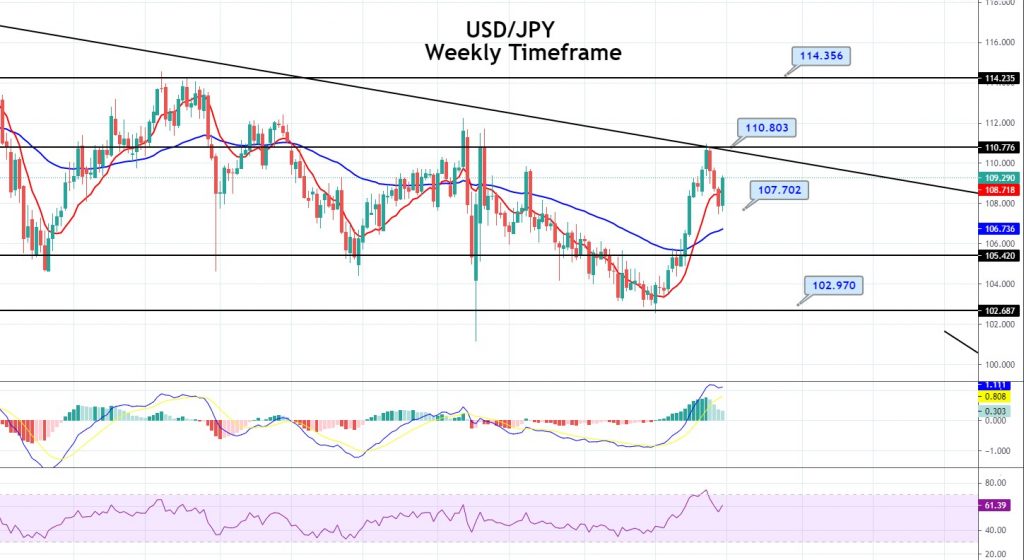
USD/JPY – Weekly Time-frame – Upward Channel
The USD/JPY pair has entered the bullish zone at 110.990 level on the weekly timeframe, and it has strong odds of a bearish correction until 38.2% Fibonacci retracement level of 107.700. A violation of the 107.700 level can extend the selling trend until the next support area of 105.600, that’s extended by 61.8% Fibonacci retracement. The series of exponential moving averages are also suggesting chances of a buying trend in the pair. These exponential moving averages are holding around 106.664 level, suggesting buying opportunities in the pair. The pair may find immediate support at the 106.664 area, and the violation of this level can lead it towards 105.45. The weekly RSI and MACD indicators support a buying trend; whereas, the pair has also formed an upward channel on the weekly timeframe that indicates strong odds of bullish trend continuation. Therefore, the violation of the immediate resistance area of 110 level can lead the USD/JPY price towards an initial target level of 112.650 and 114.350 level afterward. Good luck!
About the author
Arslan Butt serves as the Lead Commodities and Indices Analyst, bringing a wealth of expertise to the field. With an MBA in Behavioral Finance and active progress towards a Ph.D., Arslan possesses a deep understanding of market dynamics.His professional journey includes a significant role as a senior analyst at a leading brokerage firm, complementing his extensive experience as a market analyst and day trader. Adept in educating others, Arslan has a commendable track record as an instructor and public speaker.His incisive analyses, particularly within the realms of cryptocurrency and forex markets, are showcased across esteemed financial publications such as ForexCrunch, InsideBitcoins, and EconomyWatch, solidifying his reputation in the financial community.


