Crypto Strategy: Crypto Price Action

Crypto trading can feel noisy. One minute Bitcoin is pushing higher, the next minute the market pulls back sharply and everyone on social media has a different opinion. That’s exactly why many traders rely on price action.
A Crypto Price Action Strategy is a simple but powerful way to study the market by watching price itself. Instead of filling the chart with too many indicators, traders focus on candles, support, resistance, breakouts, pullbacks, volume, and trend direction.
What Is Price Action in Crypto Trading?
Price action in crypto trading is the practice of analyzing a cryptocurrency’s price movement without relying heavily on indicators. By studying candlestick patterns, trends, support and resistance, traders can better understand market sentiment and identify potential entry and exit opportunities based on real-time price behavior.
Why Does Price Action Work Well in Crypto Markets?
Price action works well in crypto markets because digital assets trade around the clock and often experience sharp price swings. By focusing on real-time market movements instead of relying solely on indicators, traders can quickly spot trends, identify key support and resistance levels, and react more confidently to changing market conditions.
| Key Point | Summary |
| Strategy type | Price action trading uses raw price movement instead of relying mainly on indicators. |
| Best used for | Spotting trends, support and resistance, breakouts, and reversal areas in crypto markets. |
| Main tools | Candlestick patterns, trendlines, support and resistance zones, volume, and market structure. |
| Best timeframes | Works across short-term and long-term charts, but higher timeframes usually give cleaner signals. |
| Main benefit | Helps traders make decisions based on real market behaviour rather than lagging indicators. |
| Main risk | Crypto markets are volatile, so false breakouts and emotional trading can lead to losses. |
| Best practice | Confirm price action signals with volume, risk management, and a clear trading plan. |
Crypto Price Action Strategy overview
- Crypto Price Action Strategy
- What Is Price Action in Crypto Trading?
- Why Price Action Works Well in Crypto Markets
- The Building Blocks of a Crypto Price Action Strategy
- Best Crypto Price Action Strategies
- Example of a Crypto Price Action Trade
- Risk Management: The Part Beginners Ignore
- Pros and Cons
- Conclusion
Core Parts of a Crypto Price Action Strategy

A strong crypto price action strategy usually includes five key parts.
1. Support and Resistance
Support is an area where price has often bounced higher. Resistance is an area where price has often been rejected lower.
For example, if Bitcoin repeatedly drops near $60,000 and then rises, traders may treat $60,000 as support. If Ethereum keeps failing near $4,000, that area may act as resistance.
Support and resistance are not exact lines. They are better viewed as zones.
2. Candlestick Patterns
Candlesticks show the open, high, low, and close for a selected time period. Popular crypto candlestick patterns include:
| Trade Element | Example |
| Entry | After bullish confirmation above $66,000 |
| Stop-loss | Below the retest low |
| Take-profit | Near next resistance |
| Risk/reward | At least 1:2 |
| Invalidation | Price closes back below $66,000 |
Candlestick patterns should not be used alone. They are more useful when they appear at important support or resistance levels.
3. Market Structure
Market structure shows whether the market is trending or ranging.
An uptrend forms when price makes higher highs and higher lows. A downtrend forms when price makes lower highs and lower lows. A sideways market forms when price moves between support and resistance without clear direction.
This simple idea helps traders avoid trading against the main trend.
4. Breakouts and Retests
A breakout happens when price moves above resistance or below support. A retest happens when price returns to the broken level before continuing.
A common bullish setup looks like this:
- Price moves above resistance
- Volume increases
- Price pulls back to retest the old resistance
- The old resistance becomes support
- Price continues higher
False breakouts are common in crypto, so traders often wait for confirmation before entering.
5. Volume Confirmation
Volume shows how much trading activity is behind a move. A breakout with strong volume is usually more meaningful than a breakout with weak volume.
If price breaks resistance but volume is low, the move may fail. If price breaks resistance with rising volume, buyers may have stronger conviction.
Price Action vs. Technical Indicators
| Factor | Price Action | Technical Indicators |
| Focus | Price movement and market structure | Mathematical calculations from price data |
| Speed | Real-time analysis | Often lags behind price |
| Chart Style | Clean and simple | Can become cluttered |
| Best For | Trends, breakouts, and reversals | Momentum and trend confirmation |
| Learning | Requires chart-reading skills | Easier for beginners |
| Entry Signals | Based on price behavior | Based on indicator signals |
| Works Best | All market conditions | Trending markets |
| Main Advantage | Shows what the market is doing now | Provides clear buy and sell signals |
Best Price Action Strategies for Crypto Trading

Trend Continuation Strategy
This strategy works when the market is already moving strongly.
A trader looks for:
- Clear uptrend or downtrend
- Pullback to support or resistance
- Bullish or bearish candlestick confirmation
- Strong risk/reward setup
In an uptrend, traders may look for buying opportunities near higher lows. In a downtrend, they may look for selling or shorting opportunities near lower highs.
Support and Resistance Bounce Strategy
This strategy works in a ranging market.
A trader buys near support and sells near resistance, or waits for rejection candles at key levels. This works best when the range is clear and price has respected both zones several times.
Breakout Strategy
This strategy works when price escapes a trading range.
A trader looks for:
- Clear resistance or support level
- Strong breakout candle
- Increased volume
- Retest of the breakout level
- Stop-loss below or above the structure
Breakout trading can be powerful, but it is risky when traders enter too late.
Reversal Strategy
A reversal strategy aims to catch a trend change.
Signs of a possible reversal include:
- Failed breakout
- Double top or double bottom
- Bullish or bearish engulfing candle
- Break of market structure
- Volume spike near a key level
Reversal trading can be profitable, but beginners should be careful because trends can continue longer than expected.
Crypto Price Action Example
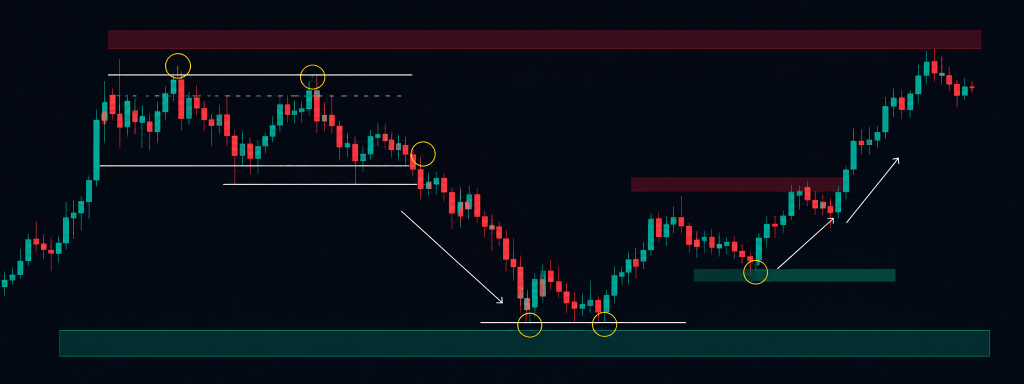
Imagine Bitcoin has been trading between $62,000 support and $66,000 resistance. Price breaks above $66,000 with strong volume, then pulls back to $66,000 and forms a bullish engulfing candle.
A trader may see this as a possible long setup.
The trade plan could be:
This is not a guaranteed trade. It is a structured decision based on price behavior.
Risk Management for Price Action Traders

Risk management is what separates disciplined trading from guessing.
Good risk rules include:
- Risk only a small percentage of account balance per trade
- Use stop-losses based on structure, not emotion
- Avoid over leveraging
- Do not enter trades without a target
- Avoid trading during extreme news volatility
- Keep a trading journal
Crypto’s 24/7 market makes stop-loss and position sizing especially important. UEEx also highlights that crypto volatility, liquidity, and emotional market behavior make risk management essential.
Common Mistakes in Crypto Price Action Trading

Many traders lose money not because price action fails, but because they use it poorly.
Common mistakes include:
- Drawing too many support and resistance lines
- Entering before confirmation
- Chasing candles after a big move
- Ignoring volume
- Trading every pattern
- Moving stop-losses emotionally
- Using too much leverage
- Forgetting that patterns are probabilities, not promises
Coincub correctly notes that chart patterns should be treated as probability tools, not certainties.
Pros and Cons
| ✓ Pros | ✕ Cons |
| Gives traders a clean view of real-time market movement | Requires practice to read charts correctly |
| Works well with support, resistance, trends, and breakouts | False breakouts can still happen, especially in crypto |
| Helps reduce reliance on too many indicators | Can feel subjective for beginners |
| Useful in trending, ranging, and volatile markets | Emotional trading can lead to poor decisions |
| Works across Bitcoin, Ethereum, and major altcoins | Lower-volume altcoins may give unreliable signals |
In Conclusion
Crypto price action trading helps traders read market movement through price, structure, support and resistance, candlestick patterns, and trend behaviour. It can be useful in volatile crypto markets because it focuses on what price is doing now rather than relying only on delayed indicators.
The best results come from using price action with a clear trading plan, defined risk management, and confirmation from volume or broader market context. Traders should avoid entering trades based on a single candle or pattern and instead look for repeated signals that support the same trade idea.
You might also like
Top 10 Cryptocurrencies to Watch in 2026
Best Cryptocurrencies to Invest in 2026
What is Cryptocurrency Staking?
Frequently Asked Questions
Is price action enough to trade cryptocurrency successfully?
Price action gives you a solid understanding of what the market is doing, but it shouldn’t be your only tool. Many experienced traders also consider volume, overall market sentiment, and proper risk management before opening a position.
Why do experienced crypto traders prefer price action?
Many traders like price action because it focuses on what the market is doing right now instead of relying on lagging indicators. A clean chart often makes it easier to spot trends, key levels, and potential trading opportunities.
Can I use price action without technical indicators?
Yes. Some traders use nothing but candlestick charts, support and resistance levels, and market structure. Others prefer adding indicators like RSI or moving averages as extra confirmation rather than making them the primary reason for entering a trade.
Which cryptocurrencies work best with price action trading?
Price action can be applied to almost any cryptocurrency, but it generally produces more reliable signals on highly liquid assets such as Bitcoin and Ethereum. Smaller altcoins can be much more volatile and are more likely to produce false breakouts.
What is the biggest mistake beginners make with price action?
A common mistake is entering a trade as soon as they spot a pattern. Waiting for confirmation, such as a candle close or a successful retest of a key level, can help reduce unnecessary losses.
How do I know if a breakout is genuine?
No breakout is guaranteed, but stronger breakouts are often supported by increased trading volume, a decisive candle close beyond resistance or support, and continued buying or selling pressure after the breakout.
Does price action work in both bull and bear markets?
Yes. Price action can be used in rising, falling, and sideways markets. The strategy simply changes depending on market conditions. In a bull market, traders often look for buying opportunities, while in a bear market they focus on rallies into resistance or breakdowns below support.
What time frame is best for crypto price action trading?
Many traders prefer the four-hour and daily charts because they filter out much of the short-term market noise. Lower time frames can offer more trading opportunities but usually require quicker decision-making and greater experience.
Can price action predict where Bitcoin will go next?
No trading strategy can predict the market with complete accuracy. Price action is designed to identify high-probability setups based on current market behaviour rather than forecasting future prices with certainty.
How long does it take to become confident with price action trading?
The learning curve is different for everyone. Most traders become more comfortable after spending time studying charts, practising with historical data, and reviewing both successful and unsuccessful trades. Consistency usually comes through experience rather than speed.
 ABOUT THE AUTHOR
See More
ABOUT THE AUTHOR
See More


Sidebar rates

Ava