Trading Course
Get Equipped for Forex Trading
- Get Equipped for Forex Trading
- Types of charts for Forex trading
- Supply and Demand
- Lines and Trends
- Trend Lines – A Basic Tool for Analyzing Trends
- Types of market analysis
- Review Course
Get Equipped for Forex Trading
Now that you wet your toes, we are ready to start swimming lessons… Let’s jump right in. We will now start giving you the basic tools necessary to be a successful Forex trader.
- Charts Types
- Supply and Demand
- Lines & Trends
- Time Frames
- Trading Styles: long, short, day, intraday, swing, scalping
- Multiple Time Frames Strategy
- Types of Analysts
We strongly advise that you to go into the demo account you opened and start practicing the lessons you will learn here. After each subject, you should go to your demo account and practice the new techniques that you just learned. Additionally, at the end of each lesson, you will find exercises to practice with.

Types of charts for Forex trading
Charts are crucial for seeing how prices move and identify trends. You’ll still rely on the basics—line, bar, and candlestick charts—but don’t be surprised if you also come across more advanced tools and indicators. These extras can give you a deeper look into market behavior and help refine your strategies.
Data regarding pairs’ rates is presented on forex trading charts. We use these charts to study and analyze the trends and movements of currencies at any given moment. Every platform offers a variety of types of charts. Each chart has advantages and disadvantages and is best for specific targets.
A trader works with the particular chart that best answers his needs. There is no correct answer here. It all depends on the trader’s character and targets.
Let’s have a look at the most familiar charts:
Line chart
Like its name, a line chart is a continuous, line-shaped diagram of the currency pair’s price movement over a chosen period. The line connects the closing price of a one-time range to the opening price of the next time range, forming a line. The advantage of line charts is that they help to build a clear picture of price movements and trends through time and help you recognize trends.
Example of a line chart for forex trading:

Bar Chart
Built of a group of poles that connect the pair’s highest price to its lowest price within a specific time range. It also shows the chosen time range’s opening and closing price.
A bar chart looks like this:

Candlestick Chart
The Candlestick chart remains a popular and effective tool for visualizing price movements and trading decisions in Forex and other financial markets. We explain it according to opening, closing, high, and low.
- Structure: Each candlestick represents a specific period (e.g., 1 hour, 1 day) and includes:
- Body: The area between the opening and closing prices.
- Shadows (or Wicks): Lines extending above and below the body, showing the highest and lowest prices during the period.
- Colors: Typically, Color represents the price direction at that time zone. Green (or white) candles show that prices rose, while red (or black) candles show that prices fell.
Each candle has the above 4 elements, as you will notice in the picture below:
Long sticks indicate intense activity (buying or selling), while short sticks suggest limited trading activity in the time range of that candle.
Lines above and below the body are called Shadows. A long shadow indicates a lot of action between the opening price and the tip of the shadow – or between the closing price and the tip of the shadow of the time range represented by the candle.
The briefer’s shadow indicates that most activity took place around the opening and closing price.
Example of Japanese Candlesticks:

Tip: We love working with Candlestick charts and recommend you use them as your primary charts. Their structure and colors are very helpful for less experienced traders. Also, they are very easy to use for trend analyses, and many forex analyses are based on candlestick forex trading strategies.
Let’s examine some of the most common types of sticks you will encounter on the platform.
This is a spinning top Japanese Candlestick formation:

A Spinning Top candlestick signals that traders are unsure about the direction of the market. Imagine a candle with a small body and long wicks (shadows) above and below it. The small body shows that the opening and closing prices were close to each other, meaning neither buyers nor sellers gained much control during that time.
The long wicks show that there was significant movement above and below the body, but it didn’t result in a strong direction.
When you see a Spinning Top on your chart, it often means the market is at a crossroads and might be ready to change direction. It’s a hint that the current trend could end, and a new trend might start soon.
This is a Marabuzo Japanese Candlestick formation:

The green candle indicates a “bully trend” (buyers’ trend), and the red candle is a “Bearish trend” (sellers’ trend). The appearance of a Marabuzo implies an upcoming reversal in the trend direction. That´s because the bearish candle, bigger than the previous candle, shows that the trend has reached a level where the sellers outnumber the buyers.
This is how the Marabuzo Candlestick formation may appear on charts:

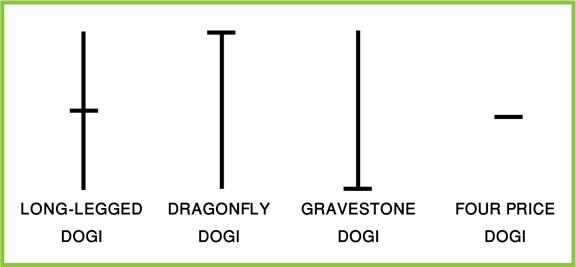
This is a Doji candlestick formation:

A Doji candlestick forms when buyers and sellers are equally matched, showing indecision in the market. In Forex trading, a Dragonfly Doji is often called a “pin,” and a Gravestone Doji is called an “upside-down pin” because of its shape.
Tip: If a Doji appears right after a strong candlestick called a Marubozu, it often indicates that a trend reversal is likely to happen soon!
This is how a Doji might appear on a chart:

Single Stick Candlestick Formation:
Hammer
What is it? A Hammer is a candlestick pattern that typically signals a potential reversal from a downtrend to an uptrend. It forms when the price drops significantly lower but rebounds to close near its opening price, resulting in a small body with a long lower shadow.
What does it indicate? The Hammer suggests that sellers were in control initially (pushing the price down), but buyers gained strength and pushed the price back up. This pattern can indicate a potential reversal from a bearish (downward) trend to a bullish (upward) trend.
Tip: Don’t rely solely on the Hammer to predict a reversal. Wait for the next candlestick to confirm the trend change. Look for a Hammer with a long lower shadow and little to no upper shadow.

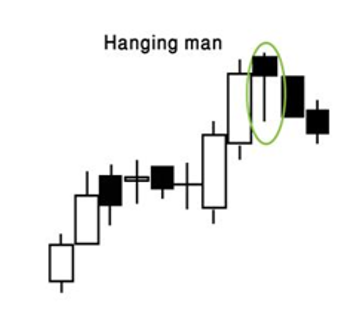
Hanging Man
What is it? The Hanging Man is the opposite of the Hammer and typically forms at the top of an uptrend. It resembles the Hammer, with a small body and a long lower shadow.
What does it indicate? The Hanging Man can signal an uptrend’s end and a downtrend’s start. It shows that sellers tried to lower the price during the trading period but could not close it significantly. However, it still indicates that selling pressure is increasing.
These patterns remain essential tools for technical analysis in Forex trading as they provide insights into potential trend reversals. However, like all indicators, they should not be used in isolation but in combination with other signals and analyses for better accuracy.
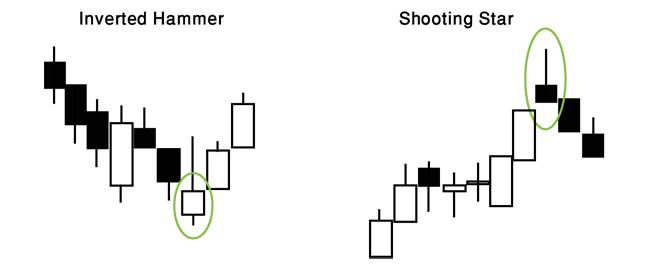
Inverted Hammer and Shooting Star
Inverted Hammer and Shooting Star are two candlestick patterns often used in technical analysis to identify potential reversals in market trends. They are characterized by their unique body and shadow formations.
The shadow of an Inverted Hammer indicates that buyers wish to reverse the trend into an uptrend. However, sellers are giving them a hard time. Nevertheless, if the stick is white (green), buyers are beating sellers. The pattern indicates a reversal from selling into buying!
Shooting Star works the same, only in the opposite direction – indicating a downtrend.
Inverted Hammer
- Body: A small, real body.
- Shadow: A long, upper shadow with a very short or no lower shadow.
Interpretation: The Inverted Hammer suggests a potential reversal from a downtrend to an uptrend. The long upper shadow indicates strong selling pressure, but the small body implies that buyers are stepping in to defend the price. If confirmed by subsequent price action, it could signal a bullish reversal.
Shooting Star
- Body: A small, real body.
- Shadow: A long, lower shadow with a very short or no upper shadow.
Interpretation: A Shooting Star forms when the price opens and moves significantly higher during the trading period but closes near its opening price, resulting in a small body and a long upper shadow. This pattern shows that buyers tried to push the price up, but sellers gained strength and pushed the price back down. This suggests that a downtrend could be starting.
Tip: Like with other candlestick patterns, wait for the next candle to confirm the trend change before making any trading decisions.”
Two candles
We recognize tweezers when the first candlestick of the two follows a trend and the second candlestick is a reversal. Usually, they are equal in size, and their shadows are the same length.

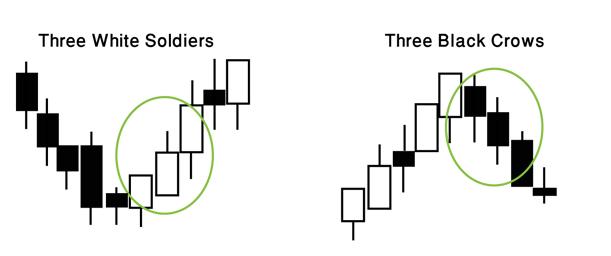
Triple Candles
Soldiers and crows first come the shortest of all three. This chart pattern points to a clear change in the trend’s direction. In this situation, the level of certainty is high (there is a very good chance of a reversal trend!). Notice that the third candlestick shows a tiny shadow (or none).
Three White Soldiers and Three Black Crows
Three Inside Up/Down
Again, both show the same form. The first candle is relatively long and goes with the direction of the trend, the second is approximately half of the length of the first, and the third closes longer than the tip of the first candle and in the opposite direction of the trend.
Three Inside Up and Three Inside Down examples:

Morning Star and Evening Star
Morning/Evening Stars usually appear at the end of a trend, signaling its end.
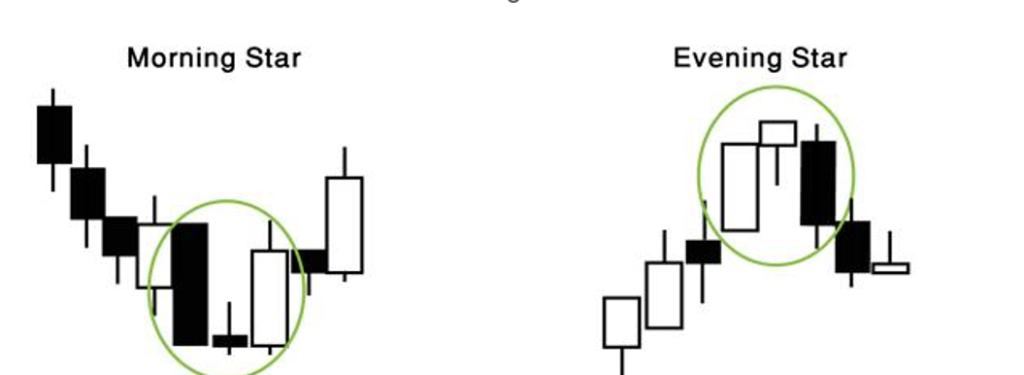
That is how it looks on a candlestick chart:

Supply and Demand
Concept: In Forex, just like in other economic markets, supply and demand are fundamental forces that determine the price of a currency. If there is more demand for a currency, its value tends to rise; if there is more supply than demand, its value tends to fall.
Factors Affecting Supply
- Inflation: Higher inflation typically decreases a currency’s value because it reduces purchasing power.
- Money Printing by the Central Bank: Increasing the money supply can lead to devaluation of the currency.
- Interest Rates: Lower interest rates can increase the supply of a currency as it becomes less attractive to investors.
Factors Affecting Demand
- Economic Growth: Positive economic indicators like GDP growth, low unemployment, and rising consumer confidence increase demand for a currency.
- Foreign Investment: When foreign investors want to invest in a country’s assets (like stocks, bonds, or real estate), they need to buy that country’s currency, increasing demand.
Market Sentiment
Definition: Market sentiment reflects the overall attitude of traders and investors toward a particular currency or the market as a whole. It’s often described as the market’s “state of mind.”
Impact on Trading
- Market sentiment can drive prices up or down regardless of fundamental data. For example, even if the economic indicators are strong, negative sentiment can decrease currency value.
- Understanding market sentiment is crucial because it often represents the collective thinking of most traders. Even if your analysis suggests a different outcome, the prevailing sentiment can still drive the market in the short term.

Lines and Trends
In Forex trading, trends are crucial because they guide our trading decisions. Understanding trends helps traders know when to buy or sell.
What is a Trend?
A trend shows the general direction of the market. There are three types of trends:
- Uptrend (Bullish) – The market is moving upwards. When prices make higher highs and higher lows, it’s an uptrend. In Forex, going “bullish” or “long.”
- Downtrend (Bearish) – The market is moving downwards. When prices make lower highs and lower lows, it’s a downtrend. This is known as going “bearish” or “short.”
- Sideways Trend (Ranging) – The market is not moving in a clear direction. Prices move within a range, forming a rectangle-like shape. This is a neutral trend in which prices keep bouncing between a high and a low.

How to Use Trends in Trading
- In an uptrend, consider buying (going long).
- In a downtrend, consider selling (going short).
- In a ranging trend, buy when the price is at the lower end of the range and sell when it is at the upper end. This simple strategy helps you take advantage of price movements within the range.
Learning to identify these trends will help you make better trading decisions and become a more successful Forex trader!
An example of a ranging trend:

The most important thing to know about a trend is its length and consistency.
Remember: a trend must contain at least two peaks or two lows to be considered a trend. If it contains three or even more points, we can be certain that we are looking at a relatively solid trend.

Trend Lines – A Basic Tool for Analyzing Trends
Trend lines are one of the simplest and most important tools you’ll use in Forex trading. You’ll find this tool in the toolbox window above the chart on your trading platform.
What is a Trend Line?
A trend line is a straight line that helps you see the direction of a trend on a chart. You draw a trend line by connecting the high points (peaks) or the low points (troughs) of the price movements.
- If you connect the lows (bottoms) of the price movements, you are drawing a line for an uptrend.
- If you connect the highs (tops) of the price movements, you are drawing a line for a downtrend.
Why Use Trend Lines?
Trend lines help you identify the direction in which the market is moving—whether it’s going up, down, or staying flat. Knowing the trend direction can help you decide whether to buy or sell.
How to Draw Trend Lines Correctly
- Make sure your trend line fits the actual highs or lows on the chart. Don’t try to force the line to fit where it doesn’t.
- Draw the line where the market naturally shows its highs and lows.
Key Tip
Always let the market guide you where you draw your trend lines. Don’t adjust the line to match what you want to see; instead, draw the line based on what the market is doing.
Using trend lines correctly will help you understand market movements and make smarter trading decisions!
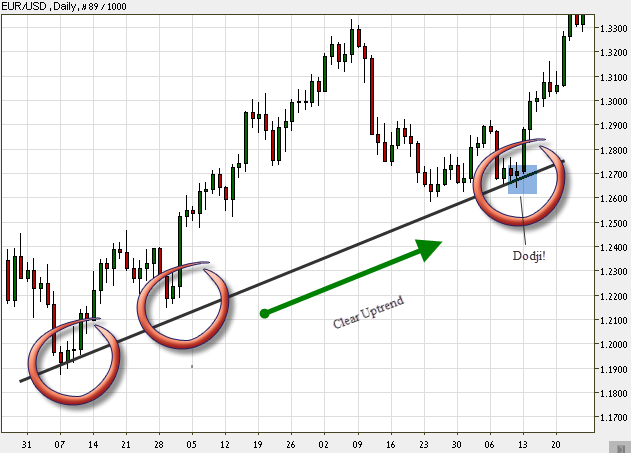
Remember: Many times, it is possible to identify changes in the trend’s direction by following breaks in the trend lines; see the examples below:

The blue line in the middle represents the current price (in our case, 1.3662). The last candlestick ends at this price.
Another example of trend lines in the Forex market:

Time Frames
For your convenience, we organized this subject as a table detailing the different time
frames:
| 🔎 Time Frame | 📌 Details | ✅ Pros | ❌ Cons |
| 📈 Long Term (Investors) | Hold Trades for Week to Years. Use Daily and Weekly Charts. | No need to follow the market constantly. | Requires a lot of patience. |
| 📉 Short Term (Swingers) | Hold trades for a few hours to a week. Use 1 hour, 4 hour, and, daily charts. | More trading opportunities. | Overnight Risks. |
| 📊 Intraday (Day Traders) | Hold trades within the day, from a few minutes to day's end. Use 1 minute, 5 minute, 15 minute charts. | No overnight Risks | Higher Costs due to more spreads. |
Trading Styles
There are several popular trading styles, each with its approach and rules. Your trading style often reflects your personality and how you handle risk. Before picking a style, it’s essential to understand your preferences and risk tolerance.
For example, ask yourself if you enjoy quick trades with high risk or prefer a more relaxed approach with fewer trades. Some traders are happy with small, consistent profits, while others aim for significant gains. There’s no single “best” style; it depends on what suits you best.
Let’s look at a few popular styles that are great for beginners and see which might be a good fit for you.
Scalpers
- What They Do: Make many trades in a short time, usually holding each trade for just minutes.
- Time Frames: 1-minute, 5-minute, or 15-minute charts.
- Pros: Lots of trading opportunities, good for quick action during work breaks.
- Cons: Fast-paced and stressful, requires lots of energy and focus.
Day Traders
- What They Do: Buy and sell within the same day, finishing all trades before the market closes.
- Time Frames: 1-hour or 4-hour charts.
- Pros: More relaxed than scalping; you don’t hold positions overnight.
- Cons: Requires a few hours each day for market analysis and monitoring.
Swing Traders
- What They Do: Hold trades for a few days to a week, aiming to profit from short- to medium-term trends.
- Time Frames: Daily or 4-hour charts.
- Pros: Less time needed in front of the screen, fits well with a full-time job.
- Cons: Must be patient and stick with the trend, even when there are short-term reversals.
Position Traders
- What They Do: Hold trades for several months or even a year, focusing on long-term trends.
- Time Frames: Weekly or monthly charts.
- Pros: Suitable for those who are very patient and have a deep understanding of the market.
- Cons: Requires significant capital, a strong grasp of global economics, and the ability to stay calm despite market fluctuations.
Multiple time frames strategy
This is a highly influential trading method! Frankly, you will use it a lot in your future trades. Multiple time frames are a tracking method on a single pair but in different time frames. Charts of the same pair look completely different in different time frames. Selecting the correct time frame is very subjective for each trader and is one of the trader’s most important decisions. We have already noticed that along with this trend, there is a series of peaks and lows.
Look at the following forex chart:

You are looking at a monthly picture. The time range of each candlestick in this chart is 2 hours. You can count a total of 360 candlesticks, equal to 1 month. Now, look at the left part and notice the peaks and lows marked as mini-trends (called secondary trends or ‘trends within a trend’), and also notice the general trend direction going up.
If we had chosen to look at the same trend but in a different time frame, say of 5-minute ranges in a 2-hour frame (meaning that each stick represents 5 minutes, and there are a total of 24 sticks in the chart), we would have gotten only a partial picture, showing only a small part of the general uptrend.
Now, assume we wish to take a look at 1-day time ranges (each stick represents 1 day), in half a year frame (182 sticks) – the chart above would turn into a minor inner part of the whole 6-month chart:

See what just happened? A trend that looked like an uptrend in a monthly chart turned out to be the beginning of a major downtrend in a six-month chart!
Conclusion: You always must examine a trade on several time frames to get a wide, clear, general view of the market!
Multiple time frames also help us determine when to enter and exit trades (waiting for critical points).
Check out this Forex chart:

You can see an example of a chart that helps us determine when to enter or exit.
Tip: The 15-minute, 30-minute, and 1-hour time ranges (where each stick represents the trading activity of 15 minutes / 30 minutes / 1 hour) are good, with average timeframes in the middle.
They are short-term but not too short, profitable but not too risky, and allow enough time and significance for the trader to analyze and evaluate markets.
Tip: You are advised to practice using different time frames in your practice accounts before trading with a real account.


Looking at the top left graph, we would have gone short (sell) because the price appears to have reached a resistance peak, suggesting that it should go down again.
Analyzing the Top Right Graph
On the top right chart, however, the situation changes. We should have gone long (buy) because the price breaks through the resistance barrier and starts moving up drastically.
Considering Different Time Frames
When we examine different time frames, particularly the bottom charts, we notice that the price is positioned at the bottom of a long-term channel (bottom left picture). This suggests it is likely to move up. Additionally, the appearance of a Doji at the last low point signals a potential trend reversal.
Tip: The wider the time frame you use, the stronger and more reliable the trading signals tend to be.
Recommended Working Method – Combining Time Frames
When analyzing a chart, if you are viewing a short time frame (e.g., 15 minutes), it’s beneficial to also check the next larger time frame (e.g., 1 hour). This allows you to see how your trade fits into the larger market picture. It’s helpful to use up to three different time frames, but avoid overcomplicating things by tracking too many charts at once.
Time Frame Considerations for Scalpers
Working with multiple time frames can be risky for scalpers, as they require quick decisions and are impacted by fast price changes. For scalpers, it’s recommended to limit the analysis to a maximum of two-time frames to avoid confusion.
Example: Three Time Frames of the Same Currency Pair
In the provided charts, the same currency pair is analyzed across three different time frames. All three charts suggest that it is a great time to buy.
Daily Japanese candlestick chart (each candle represents one day):
2 hours Japanese candlestick chart (each candle represents 2 hours):

A 15-minute Japanese candlestick chart (each candle represents 15 minutes):

In conclusion
- Long-term – helps you understand the bigger picture.
- Medium-term – presents a current picture of what’s going on at the moment and shows trading opportunities.
- Short-term – helps you determine good entry and exit points.
Types of market analysis
In the next four lessons in this course, we will explore these analyses in detail, but let’s start by introducing them:
Technical analysis
- What It Is: This method focuses on analyzing price charts and historical data to predict future price movements. It looks at patterns, trends, and price indicators to make trading decisions.
- Who It’s For: It’s great for short-term traders and those who prefer a more immediate approach. It’s also useful for anyone who wants to make quick trading decisions based on market patterns and price movements.
- Why It’s Important: Analyzing past price data helps you identify trading opportunities. This can be very effective for making short-term trades and timing your entries and exits.
Fundamental analysis
- What It Is: This method looks at economic, social, and political factors to understand how they might affect currency values. It involves studying things like interest rates, inflation, unemployment rates, and global events.
- Who It’s For: It’s particularly useful for long-term traders and investors who are interested in the broader economic picture and want to make decisions based on economic trends and news.
- Why It’s Important: It helps you understand the bigger picture and how global events can impact currency values over the long term. This can give you a strong basis for making long-term investment decisions.
Why Both Are Important
- Complement Each Other: Using both analyses together can provide a more comprehensive view of the market. Fundamental Analysis gives you insight into the overall economic conditions, while Technical Analysis helps you understand price movements and trading opportunities.
- Improved Decision-Making: Combining both methods allows you to make better-informed decisions. For example, you might use Fundamental Analysis to understand the long-term potential of a currency and Technical Analysis to find the best time to enter or exit a trade.
By understanding and using both types of analysis, you can develop a more balanced and effective trading strategy.
Important: You may and are even advised to mix the different methods. If you analyze the market with technical tools fundamental analysis will still improve your performance, and if you are a long-term investor, making decisions based on fundamental analysis, technical tools will surely boost your success.
Think about it! If you plan to buy GBP/USD, basing your decision on technical analysis, but suddenly the fourth biggest bank in Great Britain collapses, you can be sure that the trend is about to change directions, big time!

Review Course
Let’s review what you have learned so far. Don’t skip this. It will help you get comfortable with everything you have learned so far and will get you used to using the trading platform you chose. Now, practice like a real trader!
Go to your demo account and start trading. Let’s review what you learned in this chapter:
- Observe one major pair closely. Familiarize yourself with its buy/sell prices and Base/Quote currencies.
- Look at other major, minor, and exotic pairs.
- Find the timetable for different time zones during major trading sessions.
- Select candlestick charts and identify different candlestick shapes.
- Look for uptrends, downtrends, and ranging trends on the chart.
- Find the “Tools” window, select “Trend line,” and draw a trend line based on what you see.
- Select different time frames for the same pair and observe how the charts change.
- What are the symbols for the currencies in the following countries?
- U.S.A
- Europe
- Great Britain
- Australia
- New Zealand
- Switzerland
- Thailand
- Hong Kong
- China
- India
- Canada
- Japan
- Singapore
- South Africa
- What is a ‘major pair’? How many are there? Name them.
- What is an ‘exotic pair’? Give two examples.
- Do you remember the size of each of the following lots?
- Standard lot
- Mini lot
- Micro lot
- What happens when you take a “Long position”? A “Short Position”?
- Consider this Quote example:
Example Quote 1:
| EUR/USD | |
| BID | ASK |
| 1.3272 | 1.3276 |
| SELL | BUY |
- Base Currency = (answer)
- Counter = (answer)
- Bid price = (answer)
- Ask price = (answer)
- When selling Euros, 1 Euro = (answer) USD
- When buying Euros, 1 Euro = (answer) USD
- Spread = (answer)
Example Quote 2:
| EUR/USD | |
| BID | ASK |
| 1.7400 | 1.7410 |
- Base currency = (answer)
- Bid price = (answer)
- Ask price = (answer)
- When selling Pounds, 1 Pound = (answer) USD
- When buying Pound, 1 Pound = (answer) USD
- Spread = (answer)
- Pip value = (answer)
- What are the 3 most popular currencies in the Forex market?
- What percentage of market share do they take?
- Which are the best and busiest trading hours? Why?
- Time Frames- Complete the following table:
| Type | Which time charts? - Description | Pros | Cons |
| It is not necessary to spend a lot of hours in front of your computers. Relatively few transaction fees and commissions. Allows thorough planning. | |||
| For 1 hour- 1 day charts usage Usually trades last 1 day to 1 week | |||
| Intraday |
- What does a Doji look like, and what does it usually mean?
- Fundamental analysis best suits:
- Intraday
- Short term
- Long term
Answers
- S.A – (USD); Euro – (EUR); Great Britain- (GBP); Australia- (AUD); New Zealand – (NZD); Switzerland – (CHF); Thailand – (THB); Hong Kong – (HKD); China – (CNY); India – (INR); Canada – (CAD); Japan – (JPY); Singapore – (SGD); South Africa – (SAR).
- The most powerful currency pairs in the market are the USD, EUR, GBP, JPY, AUD, CAD, CHF, and NZD. All majors include the US Dollar.
- A pair that includes one major currency and one exotic currency (USD/THB; USD/BRL)
- Standard lot = 100,000; Mini lot = 10,000; Micro lot = 1,000
- Long position – A buying act when you expect that the price of a pair will increase (become stronger). In other words, buy when the Base currency is expected to gain power against the Counter currency).
Short Position – A selling act, when you expect that the price of a pair will decrease (become weaker). In other words, sell when the Base currency is expected to lose power against the Counter currency).
Example Quote 1:
Base Currency= EUR; Counter= USD; Bid price= 1.3272; Ask price= 1.3276
When selling Euros, 1 Euro = 1.3272 USD; When buying Euros, 1 Euro = 1.3276 USD
Spread = 1.3276-1.3272=0.0004
Example Quote 2:
Base currency= GBP; Bid price= 1.7400; Ask price= 1.7410; When selling Pounds, 1 Pound = USD $1.7400; when buying Pound, USD $1.7410 = 1 Pound; Spread = 1.7400 – 1.7410 = 0.0010; Pip value= 0.0001
- USD, EUR, JPY
- 85%, 39%, 19%
- 8-12 am N.Y.T, due to the congruence of two major sessions- N.Y. and London
- Time Frames: see above
11. 
Oncoming change in price direction.
- c. Long-term trades.
You did well!
In Chapter 5 – Fundamental Forex Trading Strategies, we will dive right into the fundamental analysis of forex trading. If you are less interested in fundamental trading strategies, skip straight to Chapter 6 – Technical Forex Trading Strategies and begin with technical analysis.
In either case, remember, the best way to trade Forex signals is by using both Fundamental and Technical trading strategies together.

Sidebar rates
