Trading Course
The Fibonacci Technical Indicator
- The Fibonacci Technical Indicator
- The Fibonacci Technical Indicator – Key Point Quick Overview
- Fibonacci technical trading strategy
- Understanding Pullbacks in Forex Trading
- How to Use Fibonacci
- Fibonacci trading strategy + Candlesticks
- Conclusion
- Practice
The Fibonacci Technical Indicator
In the next two chapters, you will be introduced in detail to your technical toolbox. Every professional has his working tools and so have Forex traders. Our toolbox contains a variety of analytical tools. Some of them are fantastic tools that any successful Forex trader uses regularly. Once again, these tools are helpful for efficient, professional technical analysis (which at the same time in many cases supports fundamental decisions).
Remember: The toolbox is usually in the “Tools” or “Indicators” sections at the top of the charts.
The Fibonacci Technical Indicator – Key Point Quick Overview
- ☑️ The Fibonacci Indicator is a tool for identifying potential price retracement levels.
- ☑️ Fibonacci & Technical Trading Strategies – Using Fibonacci levels to enhance trading decision-making.
- ☑️ Fibonacci & Support and Resistance – Fibonacci levels indicate potential price reversal points.
- ☑️ Fibonacci & Trend Lines – Combining Fibonacci ratios with trend lines for analysis.
- ☑️ Fibonacci & Candlestick Analysis – Using Fibonacci levels to interpret candlestick patterns effectively.
Fibonacci technical trading strategy
The Fibonacci indicator is a popular tool among Forex traders and understanding it can help you analyze price movements more effectively
Who is Fibonacci?
Fibonacci was an Italian mathematician known for discovering certain patterns in numbers. His most famous sequence starts like this: 1, 1, 2, 3, 5, 8, 13, 21, 34, 55, 89.
In this sequence:
- You can see that each number is the sum of the two preceding numbers.
- For example, 1 + 1 = 2, and 2 + 3 = 5.
What Are Fibonacci Ratios?
- From the Fibonacci sequence, we derive ratios that are essential in trading:
- For instance, if you divide one number by another in the sequence (like 5 divided by 13), you get approximately 0.382.
- This ratio is important because it helps traders identify potential price retracement levels.
Understanding Price Movements
Have you ever noticed that prices in the market don’t just move up or down in straight lines? They fluctuate, often seeming chaotic. But there’s a method to this movement:
- Prices move in trends or “waves.”
- While fundamental analysis looks at long-term trends, Fibonacci focuses on shorter trends and helps explain why prices might reverse or change direction.
Key Takeaway
The Fibonacci indicator is a powerful tool that helps traders identify potential reversal points in the market. It’s based on natural mathematical patterns that reflect how prices behave. By incorporating Fibonacci into your trading strategy, you can enhance your analysis and decision-making skills.
Next Steps
In the following chapters, we’ll explore how to apply the Fibonacci indicator in your trading strategy, so stay tuned!
This is what a standard trend looks like:

One more standard trend:

The trend is made up of three waves. It has a general direction (in this case- up), but along its way, a sudden drop takes place, before moving back up again. This drop is called “pullback”. Fibonacci examines pullbacks.
Understanding Pullbacks in Forex Trading
What is a Pullback?
- A pullback happens when prices drop briefly after a strong upward trend (bullish trend). Think of it as a small wave rolling back before the tide comes in again.
It’s usually represented by a series of small downward bars on the chart before prices start rising again.
Why are Pullbacks Important?
- Pullbacks can be fantastic opportunities for traders. They allow you to enter the market at a better price before the trend resumes its upward movement.
- In our example (you can refer to the provided graph), you can spot three great entrance points right after the pullbacks.
Example of a pullback:

The Challenge:
The tricky part is figuring out whether a price drop is just a pullback or the start of a new downward trend (a change in direction).
Making this decision in real-time can be tough, but there’s a handy tool that can help: Fibonacci Retracement!
Fibonacci to the Rescue:
Fibonacci retracement levels are based on a sequence of numbers that create important ratios. These ratios can guide us in determining how far a pullback might go.
The key Fibonacci ratios to remember are:
- 0.382 (38.2%)
- 0.500 (50%)
- 0.618 (61.8%)
Two additional ratios can be useful:
- 0.236 (23.6%)
- 0.764 (76.4%)

How to Use Fibonacci
When prices pull back, you can use these ratios to predict potential support levels where the price might bounce back up.
For example, if the price retraces to the 0.618 level, it often finds support and may continue to rise.
How to Use Fibonacci in Trading
Easy Peasy with Fibonacci!
As a trader, you don’t need to worry about complex calculations. Trading platforms, like MT4, do all the heavy lifting for you! They automatically calculate and display the Fibonacci levels right on your chart.
All you need to do is access the Fibonacci indicator, usually found in the “Tools” or “Indicators” section at the top left of the MT4 platform.
Fibonacci Ratios = Support and Resistance Levels
The Fibonacci levels act like invisible walls on your chart, serving as support and resistance These are essentially the price points where buying (support) or selling (resistance) is likely to happen.
When the market experiences a pullback (or correction), these Fibonacci ratios can help signal potential reversal points.
Fibonacci Levels in Action
The key ratios to keep in mind are 382, 0.500, and 0.618. These ratios help you determine if the price will bounce back up (indicating a continuation of the trend) or if it might be time to look out for a downtrend.
When you look at your chart, if the price drops and hovers around these Fibonacci levels, it’s a sign that the market may be ready to resume its upward trend.
Watching the Price Action
For instance, during a strong upward trend, if the price corrects and touches levels like 0.5 or 0.618, it’s generally considered a good sign that the bullish trend could continue.
Important Note: If the price dips below the 0.618 level, it’s often a warning sign. In this case, you might want to avoid entering a buy trade, as it could indicate a potential downtrend (bearish signal).
Example of a Pullback with Fibonacci
Imagine you see a strong upward trend, and then a pullback starts from the peak. If the price pulls back and stays around the 0.5 and 0.618 levels, it’s like a green light to buy again!
If it drops below 0.618, you’ll want to be cautious and consider selling instead, as this might signal a shift towards a bearish trend
Let’s look at a pullback (correction) again, but this time, with Fibonacci ratios on the chart:


Understanding Corrections in Trends
Identifying Corrections
On the EUR/JPY chart, we can observe two corrections. A correction is when the price temporarily pulls back against the prevailing trend before continuing in the original direction.
The first correction dipped down to the 500 Fibonacci level (with a slight tendency towards 0.618), while the second correction pulled back to the 0.382 level.
Fibonacci Levels and Price Action:
After these corrections, the price began to move back upwards, resuming the overall uptrend. This behavior illustrates how Fibonacci levels can act as potential reversal points, guiding traders on where to expect price action to bounce back.
When prices reach these key Fibonacci ratios, traders often look for signs of a bullish reversal. In this case, both corrections held above the significant Fibonacci retracement levels, indicating that the uptrend remains strong.
Example of the Fibonacci trading strategy on the USD/CHF chart:

Understanding Fibonacci Pullbacks in Trends
- Correction A: The price pulls back and touches the 2% retracement line. After this correction, the trend resumes upward, indicating that the buyers are still in control.
- Correction B: In this pullback, the price doesn’t reach any Fibonacci levels, suggesting that the momentum is strong. The trend continues upward, reinforcing the bullish sentiment.
- Correction C: Here, the price pulls back to the 0% retracement line and then starts to rise again. This indicates a healthy correction, as the price is finding support at this key level.
- Correction D: This time, the price drops below the 618 retracement level, cutting across all Fibonacci lines. This significant break suggests a shift in market sentiment. It’s a signal to SELL!
Still have not had enough. Let’s examine the next example of the Fibonacci strategy on the EUR/USD:
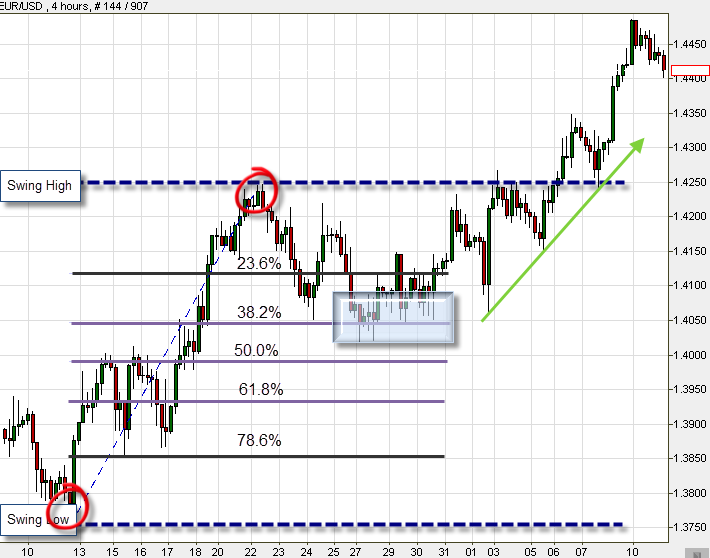
Using Fibonacci Ratios for Entry Points in an Uptrend
- Identify the Trend: Start by locating the Swing Low, which is the lowest point of the current trend. This marks the beginning of your analysis.
- Find the Swing High: Next, look for the Swing High, the highest point reached by the trend. This helps define the overall movement of the price.
- Observe the Pullback: As the price reaches the Swing High, a pullback occurs. In this case, it retraces to the 2% Fibonacci ratio. This level often acts as a support area where the price may reverse and continue the uptrend.
- Look for Reversal Signals: When the price touches the 38.2% level and starts to move upward again, it suggests that buyers are stepping back in. This is a critical moment.
- Determine the Entry Point: Since the price is reversing back towards the original uptrend, this point can be a fantastic entry opportunity for buying. Traders often look for confirmation signals, such as candlestick patterns or indicators, to ensure a safe entry
Fibonacci Trading Strategy + Support and Resistance
- Understanding the Market: Trading is all about probabilities. When you use Fibonacci levels, you can significantly increase your chances of making successful trades. Remember, thousands of traders are watching the same charts and making similar decisions. When many traders recognize the same support and resistance levels, the market tends to react in predictable ways.
Analyzing the EUR/USD Charts
First Chart:
- Uptrend: The price rises and hits a resistance level at 4245.
- Correction: The price then pulls back to 4030 before resuming its upward movement.
- Breaking Resistance: After the correction, the price breaks through the previous resistance and reaches a new Swing High, where it begins to decline again.

Second Chart:
- Support and Resistance Flip: After a support level is broken, it often becomes a resistance level (and vice versa).
- Using Fibonacci: The price drops and initially breaks the 38.2% retracement level but then stops at the 50% level. Here, it changes direction, indicating the formation of a new support level.
- Testing Support: The price tries to break the 50% support level twice without success, confirming it as a strong support zone. This can be a good entry point for new trades.
- Final Breakout: Eventually, the price breaks the current resistance level, leading to a sharp upward trend.

Understanding the Charts (EUR/USD):
In the two charts, you observed a key price movement. Let’s break it down:
- First, the 50% Fibonacci Level: This was initially a resistance level (a point where the price struggled to go higher). But, once the price broke through it, the market moved up.
- The Pullback and New Support: After the rise, the price started correcting itself, falling below the 38.2% Fibonacci level and reaching 50% again. At this point, the price stopped falling and changed direction. This confirms that the 50% level is now a strong support (instead of resistance).
- Testing the Support: The price tried to break through this 50% level twice but failed, further proving it as a solid support. This means it’s a good moment to consider entering a trade, since the price is likely to bounce back up from here.
- Big Uptrend: Finally, the price breaks through the new resistance level and moves up sharply, leading to a strong uptrend. If you had already entered a trade, this would be an excellent moment to see profits growing.
Imagine you invested 10,000 euros with 2x leverage. In less than a month, this single trade could have brought in over 2,000 euros (a 20% return)! These levels work consistently and are followed by many traders. Using them wisely can greatly improve your chances of making profitable trades!
Fibonacci trading strategy + Trend Lines
Understanding the Basics
Fibonacci levels are most effective during trendy markets where there’s strong price movement. This is when traders are actively buying or selling.
Combining Fibonacci with Trend Lines:
- Using Fibonacci levels alongside trend lines can provide powerful insights into market movements. Trend lines help us visualize the overall direction of the market (whether it’s going up or down).
Identifying Trends:
- It’s important to spot trends in the market. If you notice a clear trend, chances are, many other traders see it too. This can create a self-fulfilling prophecy, where traders react similarly to the trend, reinforcing its strength.
Example with AUD/JPY Chart:
- Take a look at the AUD/JPY chart. Here, you can observe how Fibonacci levels align with trend lines. When the price approaches a Fibonacci level that coincides with a trend line, it can act as a strong support or resistance level.

Fibonacci trading strategy + Candlesticks
Understanding Doji Candlesticks:
- Keep an eye out for Doji candlesticks. Dojis indicate that buyers and sellers are becoming indecisive, which often signals that a trend might be ending. This can mean a potential reversal in the market direction.
Using Fibonacci with Candlestick Patterns:
- Look at the sequential charts and observe how Dojis appear near Fibonacci levels. When a Doji forms at a key Fibonacci level, it can suggest that the price is about to change direction.
Key Reminder:
- While Fibonacci is a powerful tool, it’s important to remember that no indicator works 100% of the time. There will be moments when identifying Swing Lows and Swing Highs (the start and end of trends) can be challenging. Each trader has their own perspective and analysis style, which means interpretations can differ.
To improve your trading decisions, combine Fibonacci with other technical indicators you’ll learn about in future lessons. This helps enhance your ability to predict market movements. Trading is partly a guessing game, so increasing your chances of success is key.
Follow the next example in the sequential charts:


Conclusion
Fibonacci is one of our top recommended indicators due to its accuracy and reliability. It works well with other technical indicators, helping you spot important levels like supports, resistances, and reversals. By using Fibonacci alongside fundamental analysis and other tools, you can make more informed trading decisions!

Practice
Go to your Demo account. If you don’t have one yet use our definitive guide to forex brokers to choose one. Now let’s practice Fibonacci on the platform:
- Find Fibonacci on the platform (look for the technical indicators tab at the top of the chart). Click on the indicator and then click at the ‘swing low’ of the price. Hold and drag the cursor to the swing high. Discover how it appears on the chart.
- Identify the main ratios on different kinds of charts and time frames.
- With the help of Mr. Fibs, try to guess the point at which a reversal trend will appear
- Add Trendlines to the chart. Play with them a bit and try to open demo positions.
Revision Questions
- Write down the three most significant Fibonacci ratios
- Draw these three levels on the following chart. Where would you set your Stop Loss order?

Answers
- 38.2%, 50% and 61.8%

In Chapter 8 – More Technical Trading Indicators we will learn about additional technical trading indicators that will assist you in becoming a more proficient trader.

Sidebar rates
