Gold Price Forecast: $4,230 Breakout Blueprint Targets 2H Ascending Trendline Rebound
The global bullion complex has started its orderly structural consolidation in which the spot markets are locked within the heavily...
Quick overview
- The global bullion market is undergoing structural consolidation, with spot gold prices stabilizing around $4194.96 per troy ounce.
- The recent US/Iran peace treaty has eased supply risks, reducing the safe-haven premium for precious metals.
- Despite a hawkish stance from the Fed, strong central bank demand for gold continues to support its long-term price floor.
- Short-term trading strategies suggest potential bullish setups at key support levels, while bearish scenarios are also being considered.
The global bullion complex has started its orderly structural consolidation in which the spot markets are locked within the heavily defended multiple month price corridor. On Monday June 22 2026, spot gold prices created a firm holding matrix around $4194.96 per troy ounce in the afternoon early session. Institutional macro desks are continuing to soak up short-term profit-take and are re-adjusting their portfolio models to reflect the underlying fundamental of persistent physical demand and in a completely different geopolitical/monetary backdrop.
The fundamental catalyst in the tight consolidation trading today was the continued market digest of the official US/Iran interim peace treaty signed as the “Islamabad Memorandum of Understanding” at a high-profile public ceremony June 19, in Switzerland which saw the resumption of maritime commercial shipments through the vital Strait of Hormuz and front month Brent crude spot futures slip below the $80 price towards multi month lows.
This structural de-escalation of the persistent supply risk has now effectively exhausted the immediate fear-driven safe-haven premium to paper precious metals that was in play through the spring. Nonetheless macro asset managers continue to note the still volatile geopolitical landscape in which localized hot-spots continue to discourage large shorts and preserve gold’s role as a true strategic safe-haven.
More broadly, the paper price for precious metals continues to remain heavily burdened by the hawkish Fed of Chairman Kevin Warsh who concluded his FOMC June 16, 17 policy debut maintaining a strongly data dependent hard monetarist position in which sticky core inflation (4.1%) and the hot 6.5% wholesale PPI continue to rule out immediate interest rate reductions. By keeping benchmark rates pinned back while pushing out rate cut expectations further into the fall the Warsh Fed continues to provide a strong underpinning for real US bond yields and the US dollar index. In turn, this continues to place a substantial valuation barrier to global risk assets which continues to siphon speculative capital out of precious metals and force gold prices to their core fundamental support areas.
The longer term price floor remains firm with the paper trade hostage to the short term central bank position-square as underlying physical demand still benefits from:
- Strong central bank de-dollarization with the People’s Bank of China (PBOC) reporting a now 17 month non-public buying streak that continues unabated.
- Broader emerging market central banks continue their rotation out of G7 debt instruments in favor of physical gold in their long-term reserve allocations.
This unending, price-insensitive network of sovereign bids is creating a constant underlying structural demand base that has effectively counteracted the tailwinds stemming from high real yields.
Gold Technical Analysis: XAUUSD condenses intraday within the main Fib support
However, if we take our eye off the longer-term demand-supply imbalances, and look instead on the 2-hour chart, gold’s latest decline has run straight into a high-quality zone of dynamic support which offers an ideal range of entry points for short-term trading operations.
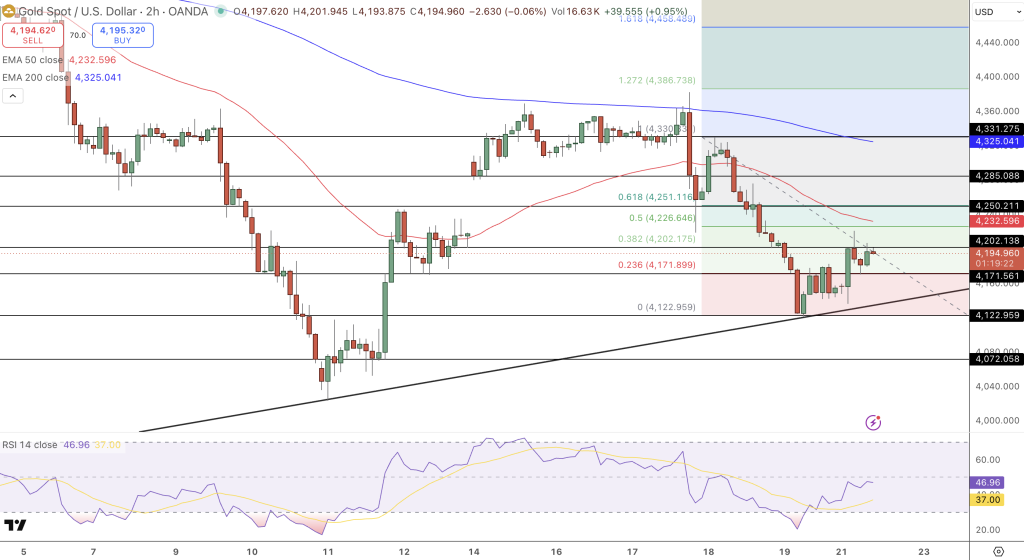
- The Black Trendline Defense: At $4,194.96, XAUUSD is upholding a steady dynamic defense along a main black ascending trendline that is a part of historical market structure. The consecutive formation of tight, low-range, small-body candles indicates that large institutional players are defending a key support base, situated at $4,171.90.
- Overhead Dynamic Moving Averages: Potential upside recovery attempts are currently hemmed in by the 2H EMA50, which is positioned at $4,232.60, as well as the larger 2H EMA200 at $4,325.04. Both EMAs are still declining and thus continue to form a wall of resistance that needs to be overcome by a substantial surge in volumes.
- Neutralized Momentum Indicators: The 14-period RSI has settled down into a neutral value of 46.96. Such a neutral print means that the aggressive downside impulse that followed the post-treaty flush has run its course, and the market is ready to be primed into another upward impulse, which should be accompanied by high volume.
Trading Action Plan
- Bullish Continuation Setup: The entry for a long position should be confirmed through candlestick support for XAUUSD at $4,171.90. The stop loss can be set below $4,122.96, whereas the profit target for the first leg will be the 2H EMA50 at $4,232.60, then the next level to aim for is 0.618 Fib at $4,251.12.
- Bearish Continuation Setup: Should a weak global PMI or another high-impact macro print cause a return to US Dollar liquidity flows, look to initiate the entry of short positions on the breakout of XAUUSD below $4,122.96. The stop can be placed above $4,185.00, with the first target at $4,072.06.
To recap, gold is making the final steps in a transition that has been in place for 17 months. While we will see high volatility in gold price in the short-term under a very strict Fed regime under the new Fed Chair Warsh, the fact that gold has seen 17 consecutive months of buying by sovereigns, and the fact that price has hit a deeply oversold 2-hour trendline support, indicates that the next phase should be another short-term rebound in gold in the near-term to late-June period.
- Check out our free forex signals
- Follow the top economic events on FX Leaders economic calendar
- Trade better, discover more Forex Trading Strategies
- Open a FREE Trading Account
- Read our latest reviews on: Avatrade, Exness, HFM and XM
Related Articles


Sidebar rates
Related Posts
