⚡Crypto Alert : Altcoins are up 28% in just last month! Unlock gains and start trading now - Click Here

UKOIL

TYPE Commodity
GROUP Stocks
BASE UKOil
SECOND
<% (signals.list.current.rate).substr(0,9) %>
<% (signals.list.current.absolute).substr(0,9) %> (<% signals.list.current.percentage|toFixed:2 %>%)
MARKETS TREND
OPEN
<% (signals.list.current.openrate).substr(0,9) %>
HIGH
<% (signals.list.current.high).substr(0,9) %>
LOW
<% (signals.list.current.low).substr(0,9) %>

UKOIL Signals

DON'T WANT TO MISS ANY SIGNAL? GO PREMIUM
ACCESS ALL FX, COMMODITIES & CRYPTO SIGNALS. GO PREMIUM
<% signal.pair %> (<% signal.rate %>)
<% signal.action %>
<% signal.status %>
Long Term
Entry Price
Stop Loss
Take Profit
PREMIUM
<% signal.stopLoss %> N/A
PREMIUM
<% signal.takeProfit %> N/A
PREMIUM
<% signal.comment %>
Description
<% signal.description %>
LATEST ANALYSIS
<% item.time_ago %> Ago
<% item.title %>
<% item.deltaTime %>

UKOIL Signals & Technical Analysis

Last Updated: <% indicators.interval.updated|date:'MMM d, y h:mm:ss a' %>
Market Trend
Strong Sell
Sell
Neutral
Buy
Strong Buy
Loading Market Trend ...

Market Sentiment

BUY: <% indicators.sentiment.buy.length %>
SELL: <% indicators.sentiment.sell.length %>
NEUTRAL: <% indicators.sentiment.neutral.length %>
Strong Sell
Sell
Neutral
Buy
Strong Buy

Trend Indicators

NAME
VALUE
ACTION
Bollinger Bands
UPPER: <% indicators.data[indicators.interval.active].bbands.value.upper %>
MIDDLE: <% indicators.data[indicators.interval.active].bbands.value.middle %>
LOWER: <% indicators.data[indicators.interval.active].bbands.value.lower %>
Sell
Buy
Parabolic SAR
<% indicators.data[indicators.interval.active].sar.value %>
Sell
Buy
Standard Deviation
<% indicators.data[indicators.interval.active].stddev.value %>
High Volatility
Low Volatility

Oscillators

NAME
VALUE
ACTION
RSI(14)
<% indicators.data[indicators.interval.active].rsi.value %>
Sell
Buy
MACD(12,26)
<% indicators.data[indicators.interval.active].macd.value %>
Buy
Sell
Neutral
ATR
<% indicators.data[indicators.interval.active].atr.value %>
High Volatility
Low Volatility
STOCH(9,6)
<% indicators.data[indicators.interval.active].stochastics.value %>
Buy
Sell
ADX
<% indicators.data[indicators.interval.active].adx.value %>
High Volatility
Low Volatility

Moving Averages

PERIOD
SIMPLE
EXPONENTIAL
MA5
<% indicators.data[indicators.interval.active].sma5.value %> Buy Sell
<% indicators.data[indicators.interval.active].ema5.value %> Buy Sell
MA10
<% indicators.data[indicators.interval.active].sma10.value %> Buy Sell
<% indicators.data[indicators.interval.active].ema10.value %> Buy Sell
MA20
<% indicators.data[indicators.interval.active].sma20.value %> Buy Sell
<% indicators.data[indicators.interval.active].ema20.value %> Buy Sell
MA50
<% indicators.data[indicators.interval.active].sma50.value %> Buy Sell
<% indicators.data[indicators.interval.active].ema50.value %> Buy Sell
MA100
<% indicators.data[indicators.interval.active].sma100.value %> Buy Sell
<% indicators.data[indicators.interval.active].ema100.value %> Buy Sell

Pivot

PIVOT
CLASSIC
FIBONACCI
CAMARILLA
WOODIE
S3
<% indicators.data[indicators.interval.active].pp.data.result.classic.s3 %>
<% indicators.data[indicators.interval.active].pp.data.result.fibonacci.s3 %>
<% indicators.data[indicators.interval.active].pp.data.result.camarilla.s3 %>
<% indicators.data[indicators.interval.active].pp.data.result.woodie.s3 %>
S2
<% indicators.data[indicators.interval.active].pp.data.result.classic.s2 %>
<% indicators.data[indicators.interval.active].pp.data.result.fibonacci.s2 %>
<% indicators.data[indicators.interval.active].pp.data.result.camarilla.s2 %>
<% indicators.data[indicators.interval.active].pp.data.result.woodie.s2 %>
S1
<% indicators.data[indicators.interval.active].pp.data.result.classic.s1 %>
<% indicators.data[indicators.interval.active].pp.data.result.fibonacci.s1 %>
<% indicators.data[indicators.interval.active].pp.data.result.camarilla.s1 %>
<% indicators.data[indicators.interval.active].pp.data.result.woodie.s1 %>
PP
<% indicators.data[indicators.interval.active].pp.data.result.classic.pp %>
<% indicators.data[indicators.interval.active].pp.data.result.fibonacci.pp %>
<% indicators.data[indicators.interval.active].pp.data.result.camarilla.pp %>
<% indicators.data[indicators.interval.active].pp.data.result.woodie.pp %>
R1
<% indicators.data[indicators.interval.active].pp.data.result.classic.r1 %>
<% indicators.data[indicators.interval.active].pp.data.result.camarilla.r1 %>
<% indicators.data[indicators.interval.active].pp.data.result.woodie.r1 %>
R2
<% indicators.data[indicators.interval.active].pp.data.result.classic.r2 %>
<% indicators.data[indicators.interval.active].pp.data.result.fibonacci.r2 %>
<% indicators.data[indicators.interval.active].pp.data.result.camarilla.r2 %>
<% indicators.data[indicators.interval.active].pp.data.result.woodie.r2 %>
R3
<% indicators.data[indicators.interval.active].pp.data.result.classic.r3 %>
<% indicators.data[indicators.interval.active].pp.data.result.fibonacci.r3 %>
<% indicators.data[indicators.interval.active].pp.data.result.camarilla.r3 %>
<% indicators.data[indicators.interval.active].pp.data.result.woodie.r3 %>

UK Crude Oil (UKOIL) Technical Analysis

UKOIL is a CFD product based upon the value of North Sea Brent Crude oil. It is denominated in U.S. dollars per barrel. Also known as Brent Blend, it is considered a light, sweet crude. Brent is an exclusively waterborne produced oil offering superior international accessibility. Geopolitical tensions, OPEC, supply levels and the current regulatory environment impact the pricing of UKOIL.

Factors affecting UK Crude Oil

The price of UKOIL is highly volatile and most of its influencing factors include supply, demand and overall market sentiment. Other factors that come into play include:

  • Natural disasters
  • Civil unrest
  • Seasonal demand
  • Opec production policies
  • Global economic growth
  • Population growth
  • Shipping availability
  • Freight rates
  • Alternative fuel

The Organisation of Petroleum Exporting Countries (OPEC) comprises 13 member states which produce and export 40% of the global oil supply. The organisation sets production targets on the basis of global demand and supply. Since it supplies nearly half of all oil produced in the world, OPEC has great influence on the direction of prices. The largest oil reserves among the OPEC member states come from Venezuela, Iran, Kuwait, Nigeria,Lybia,Iran and Saudi Arabia. Canada and Russia are among the world’s top ten oil producers but are not members of OPEC.

Technical indicators have shown Oil prices tend to go up whenever OPEC reduces production levels. It is important for traders to therefore use production targets as a price indicator. Additionally, conflicts between OPEC and non-members also have an effect on oil prices. For example,OPEC decided to cut production rates during the 2020 pandemic. Russia refused to be part of the agreement resulting into Saudi Arabia staging a price war. Thereby causing the prices to go down even further.

Announcements and Reports to Follow

DOE Oil Inventory - The Department of Energy Oil Inventory releases a report every wednesday to reveal the stock of oil in the United States. Given that the U.S is the largest oil consumer,traders need to read this report and check the demand rates. OPEC Oil Market Report - OPEC’s monthly and annual reports outline crucial price indicators that could come in handy when determining price movements.Production targets and quotas are an indication of the level of oil supply and demand across the world.

Other Oil Price Factors

Oil prices remain unpredictable amid unexpected swings in the factors that affect. As we know, the coronavirus (COVID-19) pandemic has sent the demand for oil falling. Meanwhile, the rising U.S. oil production, the diminished clout of OPEC, and the strengthening dollar also played their major role in undermining the crude oil prices.

1. Slow Global Fuel Demand:

The U.S. Energy Information Administration (EIA) estimates global oil and liquid fuels demand was 92.2 million barrels per day (b/d) in 2020. That’s down by 9 million b/d from 2019. It expects demand to rise by 5.6 million b/d in 2021 and 3.3 million b/d in 2023.

2. Rising U.S. Oil Output:

The U.S. producers of shale oil and alternative fuels, such as ethanol, also increased supply. They increased supply gradually, which kept prices high enough to pay for exploration costs. Many shale oil producers turned out more effective at extracting oil. They found ways to keep wells open, saving them the cost of capping them. This ramp-up began in 2015 and has affected supply ever since.

It is worth recalling that the U.S. became the world’s biggest oil producer in August 2018. In September 2019, U.S. crude oil production rose to a record 12.1 million b/d. It was the first time since 1973 that the U.S. exported more oil than it imported. U.S. crude oil production reached 11.2 million b/d in November 2020, up from 10.9 b/d in September due to hurricane-related production decreases in the Gulf of Mexico region. It’s estimated that it dropped to 11.3 million b/d in 2020 and will fall to 11.1 million b/d in 2021, down from 12.2 million in 2019. It’s expected to increase to 11.5 b/d in 2022.

3. Rising Dollar Value:

Foreign exchange traders have been supporting the value of the U.S. dollar since 2014 as traders normally use the US dollar as a safe haven investment during times of economic uncertainty. For example, the US dollar’s value grew by 30% between 2013 and 2016 in response to the Greek debt crisis and Brexit. Afterward, the US dollar rose 8.4% in the wake of the coronavirus pandemic between March 3 and March 23, 2020.

As we are all well aware, all of the oil transactions are paid in U.S. dollars. Most oil-exporting countries peg their currencies to the dollar. As a result, a 25% rise in the dollar offsets a 25% drop in oil prices. Global economic uncertainty tends to underpin the safe-haven US dollar

UKOIL - FAQs

Is UKOIL a good trading pair?

Brent crude, produced from oil fields in the North Sea and traded on the UKOIL exchange, is widely used as the global benchmark for oil prices. Approximately two-thirds of all oil futures traded are based on Brent crude, making it an ideal asset for Forex traders to pair with the US Dollar or the Euro.

Is UKOIL/USD bullish or bearish?

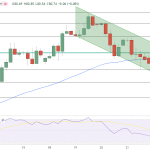
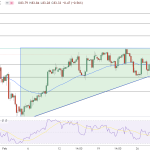
UKOIL/USD trading pair is trading in the descending channel. The market is experiencing sharp and shallow bearish moves. Despite the price testing the psychological and resistance level, the price could record a downtrend in the nearing days. However, the long-term outlook seems promising for the bulls.

Is UKOIL getting stronger against USD?

The rise in UKOIL exports has led to a decrease in imports, thus mitigating the impact of higher oil prices on the U.K. trade deficit. Consequently, the inverse relationship between oil prices and the Euro, which is traditionally quite strong, is becoming less reliable.

What Affects UKOIL?

The price of UKOIL/USD can be affected by a variety of factors such as supply and demand, economic indicators, geopolitical events, and natural disasters. Noteworthy is the influence of OPEC's (Organization of the Petroleum Exporting Countries), Oil Production news as well as technological innovations such as Hydraulic Fracturing (fracking) and seasonal demand on crude oil prices throughout history.