Brent Oil – Forecast Summary
| Brent Oil Forecast: H1 2021 Price: $56.95 Price drivers: Bearish Correction, Doji Patterns, Downward Trendline |
Brent Oil Forecast: 1 Year Price: $48.80 Price drivers: Stronger Dollar Over Hawkish FOMC, Downward Trendline, 20 & 50 EMA Crossover |
Brent Oil Forecast: 3 Years Price: $114 Price drivers: Upward Trendline Breakout, Better Economic Conditions, Improved Production & Oil Demand |
Brent oil is exhibiting solid bullish bias since the market has started recovering from the COVID-19 pandemic. Overall, U.K. Oil has added +$ 2.23 in its prices and reports a surge of 1.54% in a period of just one month. Brent oil is currently trading at $ 67.20, bouncing off the September 2001 low of $16.65. The commodity has lost -$ 14.52, or -25.2%, over the past six months and has lost -$ 16.34 during the past year. At the same time, it has lost -$ 3.64 or -7.4% % in the past five years. Brent Oil has been a good investment since it offers many long-term and short-term trading opportunities.
In 2020, Brent crude oil prices traded within a wide range. After averaging $64/b in January 2020, the Brent oil prices dropped to an average of $18/b in April, the lowest monthly average price in real terms since February 1999. The reason could be tied to the significant declines in oil consumption that caused a speedy rise in global oil inventories. Afterward, the UK oil prices rose through much of the rest of 2020 amid rising oil demand and reduced production, which pushed the global oil inventories down and contributed to the Brent oil gains. It is worth recalling that the Brent prices increased to a monthly average of $50/b in December 2020, gaining support from the hopes of future economic recovery based on optimism over development of coronavirus vaccines.
Recent Changes in the Brent Oil Price:
| Period | Change ($) | Change % |
| 30 Days | +$2.23 | +1.54% |
| 6 Months | –$14.52 | –24.2% |
| 1 Year | –$16.34 | –26.3% |
| 5 Years | –$3.64 | –7.4% |
| Since 2000 | +17.04 | +60.8% |
UKOil Live Chart
Brent Oil Price Prediction for the Next 5 Years
Lately, Brent Oil has traded exactly in line with our 2020 forecast. The global economic improvements and various uncertainties over the continuous surge in COVID-19 cases could push Brent oil prices higher or lower respectively than EIA’s current price forecast. This price path reflects global oil consumption increasing by 6% from 2020 to reach an average of 97.8 million b/d in 2021 and by an additional 3% in 2022. But these forecasts are not sure as the current story over the fuel demand could be totally changed once populations are widely vaccinated.
Brent crude oil prices averaged $50 per barrel (/b) in December 2020, up to $7/b from November’s average. They are expected to average $53/b in 2021, as per the U.S. EIA, Administrator by Linda A. Capuano, Short-Term Energy Outlook released on January 12, 2021. Oil is inversely related to the price of gold, which is the ultimate safe haven; thus, both are affected by the same events, only that the price action is negatively correlated. One of those factors is the USD price, impacting Oil prices from 2014 until 2015. The market risk sentiment is also playing a major role in influencing the higher-yielding oil prices as commodities are very vulnerable to the sentiment in financial markets. We will look into these factors in the sections below.
In January 2021, Brent oil prices hit their highest levels ten months after Saudi Arabia announced a 1-month one-sided cut to its crude oil production for February and March, which were later extended into April. These cuts were besides OPEC+ promises. The U.S. Energy Information Administration (EIA) anticipates Brent crude oil prices to average $53/b in both 2021 and 2022. Saudi Arabia’s one-sided outputs cut means global oil market balances will be tighter in early 2021 than EIA had previously expected. The U.S. Energy Information Administration (EIA) anticipates that the global oil inventories will drop by 2.3 million b/d in the 1st-quarter of 2021, which EIA expects will contribute to Brent prices averaging $56/b.
Despite the bullish forecast for Brent oil prices in early 2021, the U.S. Energy Information Administration (EIA) remains uncertain amid high global oil inventory levels and excess crude oil production capacity, which keeps fueling the fears of oversupply issues. EIA expects modest downward price pressures on Brent oil by the start of the 2nd-quarter of 2021 when global oil production will likely rise and cause inventories to draw at a slower pace. Brent oil prices are anticipated to average $51/b during the second half of 2021. Considering the slow economic recovery all over the world amid Covid-19, the oil demand is likely to face a hit, and thus, its price may trade bearish in the second half of 2021. However, in the next five years, things are expected to be much better than now, leading Brent Oil prices to rise up to $116.
Factors Affecting Bearish Oil in 2021:
Oil prices remain unpredictable amid unexpected swings in the factors that affect. As we know, the coronavirus (COVID-19) pandemic has sent the demand for oil falling. Meanwhile, the rising U.S. oil production, the diminished clout of OPEC, and the strengthening dollar also played their major role in undermining the crude oil prices.
1: Slow Global Fuel Demand:
The U.S. Energy Information Administration (EIA) estimates global oil and liquid fuels demand was 92.2 million barrels per day (b/d) in 2020. That’s down by 9 million b/d from 2019. It expects demand to rise by 5.6 million b/d in 2021 and 3.3 million b/d in 2022.
2: Rising U.S. Oil Output:
The U.S. producers of shale oil and alternative fuels, such as ethanol, also increased supply. They increased supply gradually, which kept prices high enough to pay for exploration costs. Many shale oil producers turned out more effective at extracting oil. They found ways to keep wells open, saving them the cost of capping them. This ramp-up began in 2015 and has affected supply ever since.
It is worth recalling that the U.S. became the world’s biggest oil producer in August 2018. In September 2019, U.S. crude oil production rose to a record 12.1 million b/d. It was the first time since 1973 that the U.S. exported more oil than it imported. U.S. crude oil production reached 11.2 million b/d in November 2020, up from 10.9 b/d in September due to hurricane-related production decreases in the Gulf of Mexico region. It’s estimated that it dropped to 11.3 million b/d in 2020 and will fall to 11.1 million b/d in 2021, down from 12.2 million in 2019. It’s expected to increase to 11.5 b/d in 2022.
3: Rising Dollar Value:
Foreign exchange traders have been supporting the value of the U.S. dollar since 2014 as traders normally use the US dollar as a safe haven investment during times of economic uncertainty. For example, the US dollar’s value grew by 30% between 2013 and 2016 in response to the Greek debt crisis and Brexit. Afterward, the US dollar rose 8.4% in the wake of the coronavirus pandemic between March 3 and March 23, 2020.
As we are all well aware, all of the oil transactions are paid in U.S. dollars. Most oil-exporting countries peg their currencies to the dollar. As a result, a 25% rise in the dollar offsets a 25% drop in oil prices. Global economic uncertainty tends to underpin the safe-haven US dollar.
|
Global Petroleum and Other Liquid |
||||
| 2018 | 2019 | 2020 | 2021 | |
| Weighted by oil consumption. Foreign currency per U.S. dollar. |
||||
| Supply & Consumption | (million barrels per day) | |||
| Non-OPEC Production | 64.06 | 65.99 | 63.61 | 65.28 |
| OPEC Production | 36.75 | 34.65 | 30.61 | 34.09 |
| OPEC Crude Oil Portion | 31.44 | 29.27 | 25.75 | 29.31 |
| Total World Production | 100.81 | 100.64 | 94.22 | 99.37 |
| OECD Commercial Inventory (end-of-year) | 2,865 | 2,893 | 2,859 | 2,757 |
| Total OPEC surplus crude oil production capacity | 1.56 | 2.52 | 5.83 | 2.87 |
| OECD Consumption | 47.82 | 47.49 | 42.71 | 45.72 |
| Non-OECD Consumption | 52.67 | 53.75 | 50.43 | 54.45 |
| Total World Consumption | 100.49 | 101.25 | 93.14 | 100.16 |
Source: EIA
Monero Coin (XMR) Forecast for 2021: Will the XMR/USD Continue to Rise in 2021?
Ethereum (ETH) Price Prediction For 2021: Will Buyers Break 2017 Highs Soon?
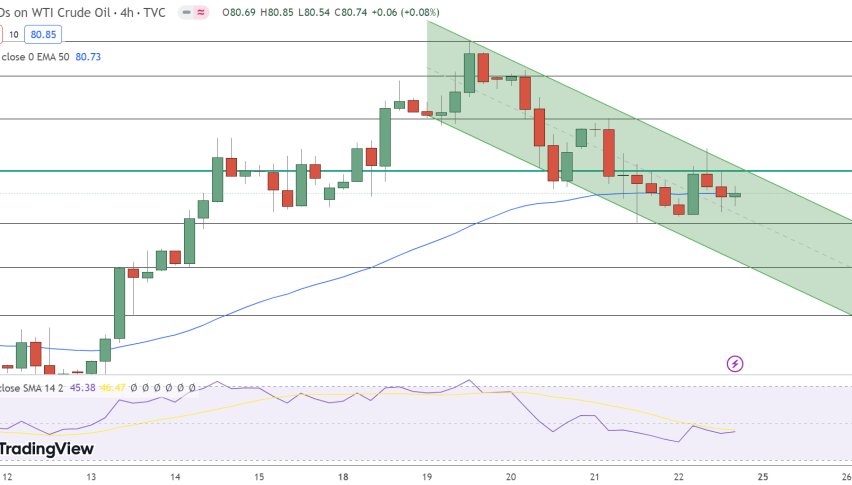
Technical Analysis – Brent Oil Enters Overbought Zone
On the technical front, the bulls dominate Brent Oil demand as it trades at the $67.44 level, and the leading technical indicator, the MACD (Moving average convergence divergence), is exhibiting a bullish trend in the Brent Oil. On the monthly time-frame, the MACD and RSI have crossed over the mid-level (0 level), and 50 respectively, which exhibits a strong bullish trend in the U.K. Oil price. Brent has closed a series of bullish engulfing candles on the monthly time-frame typically known as three white soldiers. These kinds of patterns usually drive strong bullish movements; however, Brent Oil is now facing a resistance at $71.60 level.
We can see a downward trendline extending resistance around the $71.60 mark on the monthly time-frame, and closing of candles below this level adds strong odds of bearish correction in Brent Oil until $50l. However, the $71.60 level’s bullish breakout can lead to the next target level of $88.45. Further above this level, the Brent can face the next resistance around $115.50.
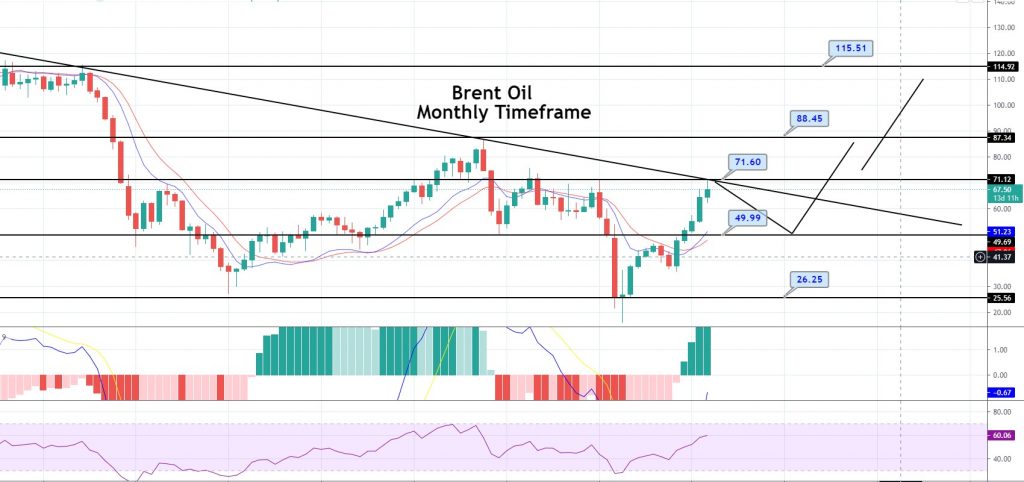
Brent Oil – Monthly Time-frame – Trendline Resistance
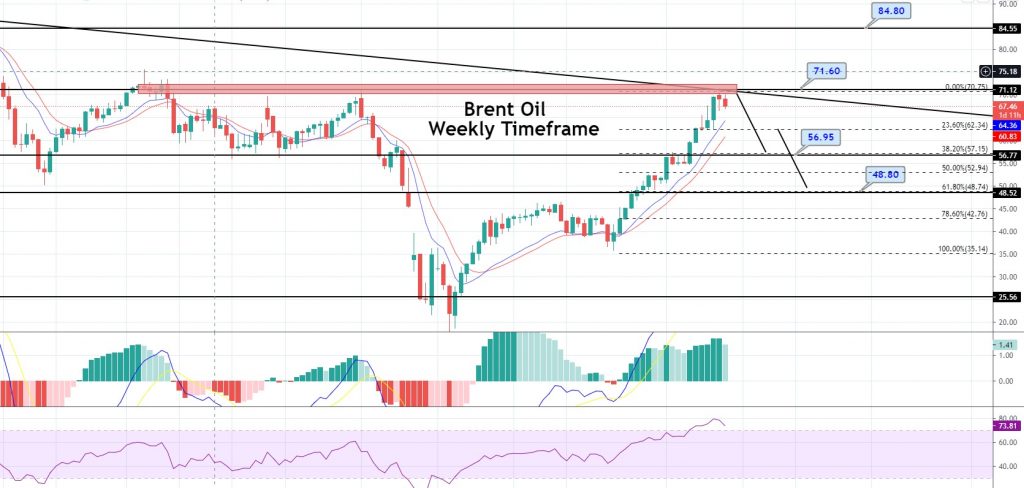
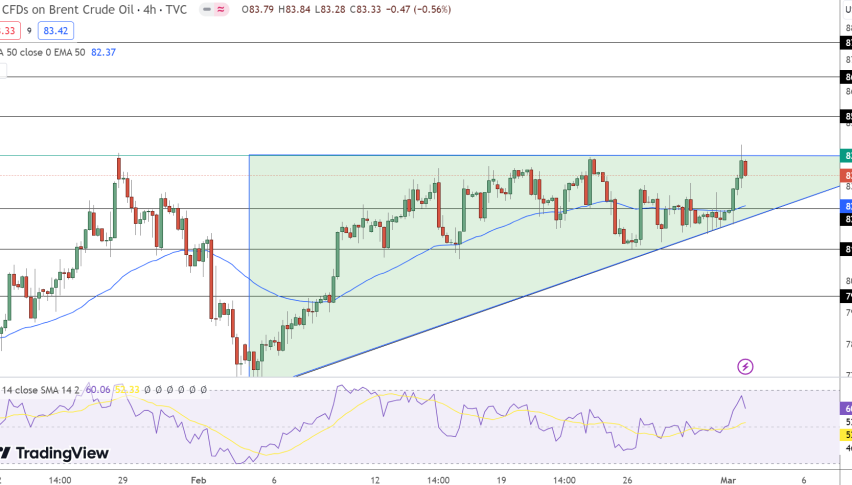
Brent Oil – Weekly Time-frame – Upward Channel & Doji Pattern
On the weekly time-frame, Brent Oil has closed a Doji pattern below $71.60 resistance, and at the same time, the MACD and RSI are also hitting the overbought zone. Technically this means the bulls are exhausted, and they may start profit-taking in the overbought Brent Oil. That being said, Brent prices may drop until the $62.34 (23.6% Fibo) level at first, and later the violation of the $62.34 level can lead Brend price towards the next support area of $56.95, a level that marks 38.2% Fibonacci retracement. If Brent Oil fundamental continues to pressure the oil market, we may see further drop in until 61.8% Fibonacci retracement level of $48.80. However, UK oil may continue to trade bullish on the breakout of $71.60 level to target next resistance around $84.80. Good luck!