Prices Forecast: Technical Analysis
For Solana, the predicted daily closing price is $139.12, with a range between $138.65 and $139.60. The weekly closing price is forecasted at $139.44, with a range from $138.18 to $139.60. The RSI at 40.9694 suggests a neutral to slightly bearish trend, indicating potential for a price rebound if buying pressure increases. The ATR of 8.1825 points to moderate volatility, suggesting that price swings could be contained within the forecasted range. The MACD line is below the signal line, indicating bearish momentum, but the histogram shows a narrowing gap, hinting at a potential reversal. The ADX at 18.9201 suggests a weak trend, implying that significant price movements are unlikely without new market catalysts. Overall, the technical indicators suggest a cautious outlook, with potential for stabilization or slight upward movement if market conditions improve.
Fundamental Overview and Analysis
Solana has experienced a volatile market environment recently, with prices fluctuating due to broader market trends and investor sentiment. The asset’s value is influenced by its technological advancements, such as its high-performance blockchain capabilities, which attract developers and projects. However, competition from other blockchain platforms and regulatory uncertainties pose challenges. Investor sentiment remains mixed, with some viewing Solana as undervalued due to its potential for scalability and expansion. The current valuation appears fair, considering the asset’s technological strengths and market position. Opportunities for growth include increased adoption and integration into decentralized finance (DeFi) and non-fungible tokens (NFTs). However, risks such as market volatility and potential regulatory changes could impact its future performance. Overall, Solana’s fundamentals suggest a balanced outlook, with potential for growth if it can navigate the competitive and regulatory landscape effectively.
Outlook for Solana
Solana’s future outlook is shaped by its ability to maintain technological leadership and expand its ecosystem. Current market trends show a consolidation phase, with historical price movements indicating potential for stabilization. The primary factors influencing Solana’s price include economic conditions, technological advancements, and regulatory developments. In the short term (1 to 6 months), Solana’s price is expected to remain within a moderate range, with potential for upward movement if market sentiment improves. Long-term forecasts (1 to 5 years) suggest growth potential, driven by increased adoption and integration into emerging sectors like DeFi and NFTs. External factors such as geopolitical issues or market crashes could significantly impact Solana’s price. Overall, Solana’s outlook is cautiously optimistic, with opportunities for growth balanced by potential risks.
Technical Analysis
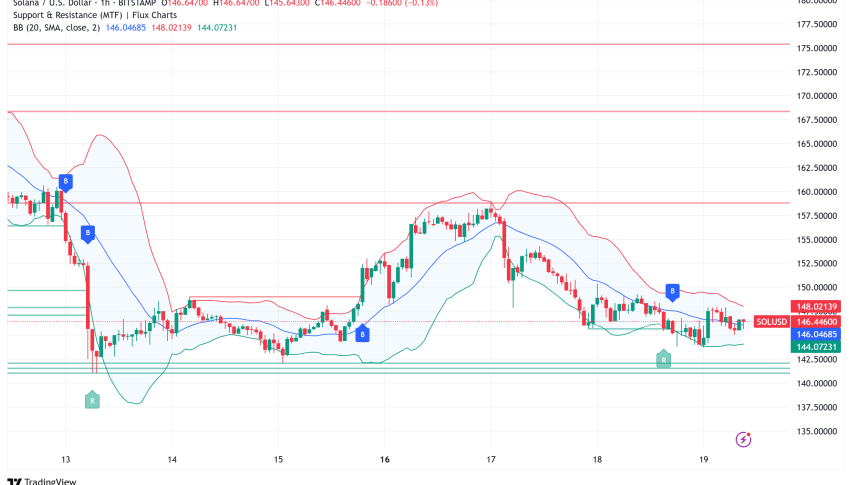
Current Price Overview: Solana’s current price is $138.8097, slightly below the previous close of $138.8097. Over the last 24 hours, the price has shown a slight downward trend with moderate volatility, as indicated by the ATR. Support and Resistance Levels: Key support levels are at $138.65, $138.50, and $138.18, while resistance levels are at $139.12, $139.44, and $139.60. The pivot point is at $138.97, with Solana trading slightly below it, suggesting a bearish sentiment. Technical Indicators Analysis: The RSI at 40.9694 indicates a neutral to bearish trend. The ATR of 8.1825 suggests moderate volatility. The ADX at 18.9201 indicates a weak trend, with no significant directional strength. The 50-day SMA and 200-day EMA show no crossover, indicating a lack of strong momentum. Market Sentiment & Outlook: Sentiment is currently bearish, as Solana trades below the pivot point, with RSI and ADX suggesting weak momentum. The lack of a moving average crossover further supports a cautious outlook.
Forecasting Returns: $1,000 Across Market Conditions
The table below outlines potential returns on a $1,000 investment in Solana under different market scenarios. In a Bullish Breakout scenario, a 10% price increase could raise the investment to approximately $1,100. In a Sideways Range scenario, a 0% change would maintain the investment at $1,000. In a Bearish Dip scenario, a 10% decrease could reduce the investment to around $900. These scenarios highlight the importance of market conditions on investment outcomes. Investors should consider their risk tolerance and market outlook when deciding to invest in Solana. Practical steps include monitoring market trends, setting stop-loss orders to manage risk, and diversifying investments to mitigate potential losses. Overall, while Solana presents growth opportunities, investors should remain cautious and informed about market dynamics and potential risks.
| Scenario | Price Change | Value After 1 Month |
|---|---|---|
| Bullish Breakout | +10% to ~$153.69 | ~$1,100 |
| Sideways Range | 0% to ~$138.81 | ~$1,000 |
| Bearish Dip | -10% to ~$124.93 | ~$900 |
FAQs
What are the predicted price forecasts for the asset?
The predicted daily closing price for Solana is $139.12, with a range between $138.65 and $139.60. The weekly closing price is forecasted at $139.44, with a range from $138.18 to $139.60. These predictions are based on current technical indicators and market conditions.
What are the key support and resistance levels for the asset?
Key support levels for Solana are at $138.65, $138.50, and $138.18, while resistance levels are at $139.12, $139.44, and $139.60. The pivot point is at $138.97, with Solana currently trading slightly below it, indicating a bearish sentiment.
Disclaimer
In conclusion, while the analysis provides a structured outlook on the asset’s potential price movements, it is essential to remember that financial markets are inherently unpredictable. Conducting thorough research and staying informed about market trends and economic indicators is crucial for making informed investment decisions.