
NFLX

 <% (signals.list.current.rate).substr(0,7) %>
 <% signal.analyst %>

Last Updated: Jul 17, 2026 03:27:28 PM (GMT)
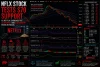
NFLX: The current market price is 68.21, reflecting a +1.67% change from the previous price.
Support and Resistance Levels Current support levels are at 66.01, 64.44, and 63.58, while resistance levels are at 68.44, 69.30, and 70.87. The pivot point is 66.87.
Indicators The RSI is at 38.82, down from a recent high, indicating bearish momentum. The ATR is 0.86116, suggesting increased volatility. The ADX is 53.84, indicating a strong trend. The 50-day SMA is at 71.57, while the 200-day EMA is at 72.72. The Parabolic SAR is at 73.68, suggesting a potential bearish trend continuation.
Market Sentiment Given the price is below the pivot point of 66.87 and the indicators indicate bearish conditions, a bearish scenario is likely.
NFLX Signals & Technical Analysis
Market Sentiment
Trend Indicators
Oscillators
Moving Averages
Pivot
About (NFLX) Netflix, Inc.
Company Background
Netflix, Inc. (NASDAQ: NFLX) is a leading streaming entertainment service with over 200 million subscribers worldwide. Established in 1997, the company initially started as a DVD rental service but quickly pivoted to a subscription-based streaming model in 2007. Headquartered in Los Gatos, California, Netflix has transformed the way audiences consume content by delivering a vast library of films, TV shows, and documentaries directly to consumers' devices. The platform is known for its original programming, which includes award-winning series like "Stranger Things," "The Crown," and "Squid Game," setting new benchmarks for creativity in the entertainment industry.Market Position
As a pioneer in the streaming industry, Netflix holds a dominant position in the global market. It competes with other media giants such as Amazon Prime Video, Disney+, and HBO Max, but has maintained its leading edge through continuous innovation and investment in original content. The company's commitment to providing high-quality, diverse programming has allowed it to capture a wide audience, making it a cultural phenomenon. Netflix’s user-friendly interface, personalized recommendations, and global reach further enhance its attractiveness to subscribers, supporting its ongoing growth and resilience against market competition.Key Financial Highlights
With a robust revenue model, Netflix reported revenues exceeding $30 billion in 2022, driven by subscription growth and increased content investment. The company has consistently demonstrated strong financial performance, including double-digit growth in paid memberships and a significant increase in average revenue per user (ARPU). Netflix's strategic focus on original content production continues to pay dividends, as evidenced by a consistent rise in viewership and critical acclaim. The company's investment in technology and data analytics allows it to optimize content delivery and enhance the user experience, solidifying its position as a market leader.Industry Highlights
As digital content consumption trends evolve, Netflix remains at the forefront of industry changes. The company is exploring opportunities in gaming and podcasting, diversifying its offerings to maintain subscriber engagement. Furthermore, as competition intensifies, Netflix continues to adapt its strategies, including potential ad-supported subscription tiers and international expansion, ensuring sustainable growth in an ever-changing media landscape.How to Buy or Trade Netflix, Inc. Stock (NFLX) with AvaTrade
Trading or investing in Netflix, Inc. stock through AvaTrade starts with opening a verified trading account. After registration, complete the KYC verification process by submitting your ID and proof of address, then fund your account using a supported payment method such as bank transfer, debit card, or e-wallet. Once your funds reflect, log into the AvaTrade platform or mobile app and search for the ticker symbol NFLX, which represents Netflix, Inc.. Before placing a trade, review the live Netflix, Inc. share price, market trend, spread, leverage options, and recent market news that could impact the stock price.
The next step is deciding whether you want to buy or sell Netflix, Inc. stock. Traders expecting the price to rise typically open a Buy position, while traders expecting weakness in the sector may open a Sell position using CFDs. Enter your preferred trade size, then apply risk management tools such as a stop-loss to limit downside exposure and a take-profit order to secure profits automatically. After confirming the trade, monitor key drivers including Netflix, Inc. earnings reports, product or service announcements, business segment performance, revenue growth, and overall stock market sentiment. Many traders also use technical indicators such as moving averages, RSI, and support/resistance levels available on the AvaTrade platform to improve timing and trading decisions.
Related Stocks


Sidebar rates
- <% signal.pair %>
 <% signals.active.Current.rate.substr(0,7) %>
Ava

