Divergence Trading Strategies
Beyond fundamental analysis, traders and analysts rely heavily on a range of technical indicators to predict potential price movements in the financial markets.
These indicators simplify the process of recognizing patterns and forecasting the likely trend direction of an asset.
In fact, it’s these indicators that make accurate Forex signals possible. They enable comprehensive, real-time assessments of price action, helping traders identify key opportunities. At FX Leaders, our team incorporates these tools daily to refine trading strategies and improve decision-making.
What Is Divergence?
Divergence is a powerful leading indicator used to identify potential trend reversals or continuations before they occur. It involves analyzing the relationship between price movements and various momentum indicators to spot discrepancies that signal changes in market conditions.
At FX Leaders, we leverage divergence analysis to enhance profitability by pinpointing optimal entry and exit points. Divergence occurs when the price of an asset moves in one direction while an indicator, such as the Relative Strength Index (RSI) or the Moving Average Convergence Divergence (MACD), moves in the opposite direction. This signals a potential shift in market momentum.
Enhancing Accuracy with Additional Tools:
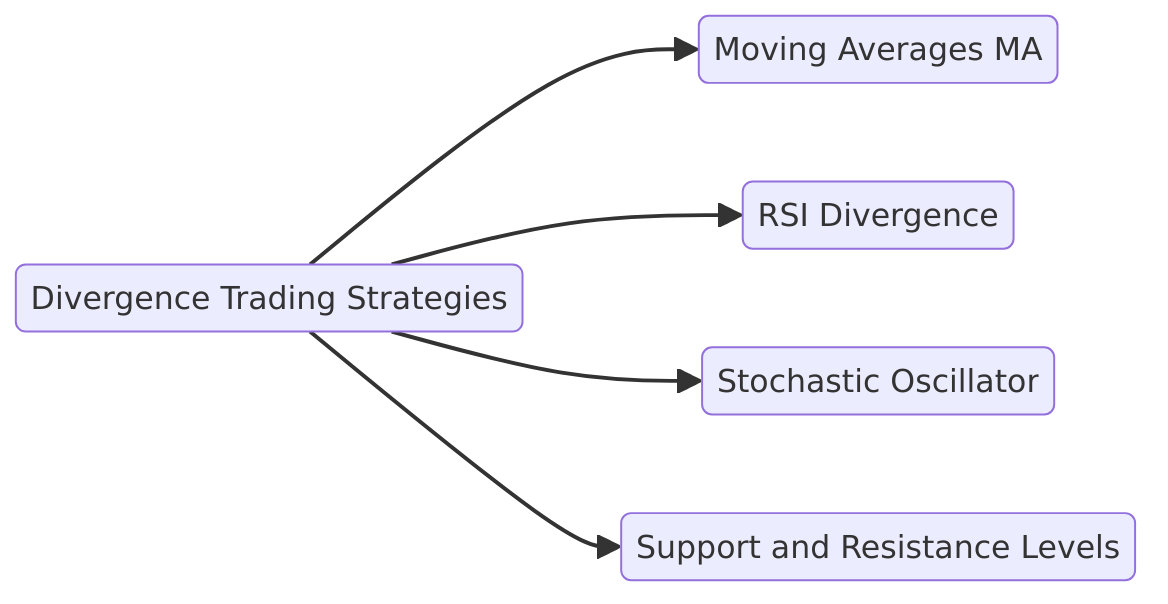
While divergence is effective on its own, combining it with other technical indicators can significantly improve trading decisions. These include:
- Moving Averages (MA): For identifying long-term trend direction.
- RSI Divergence: To spot overbought and oversold conditions.
- Stochastic Oscillator: For confirming momentum changes.
- Support and Resistance Levels: To validate divergence signals and reduce false signals.
By integrating divergence trading strategies with these tools, traders can boost their chances of entering the market at the right time, in the right direction, and with greater confidence.
What Is Divergence Trading?
As the name suggests, divergence trading is based on identifying a disharmony or deviation between price movements and technical indicators. This strategy is widely used by Forex traders around the world because of its effectiveness in spotting potential trend reversals and continuation patterns.
The Core Concept of Divergence:
In an ideal scenario, prices and indicators (like the Relative Strength Index (RSI), Moving Average Convergence Divergence (MACD), or Stochastic Oscillator) should move in the same direction. For example:
- If the price forms a higher high, the indicator should also form a higher high.
- If the price forms a lower low, the indicator should mirror that with a lower low.
However, when this correlation breaks—meaning the price and the indicator are moving in opposite directions—a divergence signal is formed. This indicates that the current trend might be weakening or a trend reversal could be imminent.
- Regular Bullish
- Hidden Bullish
- Regular Bearish
- Hidden Bearish
We will explain each type and how to trade the corresponding divergence forex strategy.

How Divergence Trading Works:
A divergence strategy involves applying specific trading rules to identify market opportunities through these discrepancies. Traders compare the highs and lows of both the price and the indicator to detect divergence.
Key Indicators for Divergence Trading:
- Stochastic Oscillator: Helps identify overbought and oversold conditions.
- Relative Strength Index (RSI): Highlights shifts in price momentum.
- MACD (Moving Average Convergence Divergence): Tracks trend strength and momentum changes.
- Trade Volume: Provides confirmation for divergence signals by measuring the strength of buying or selling activity.
Types of Divergence in Trading
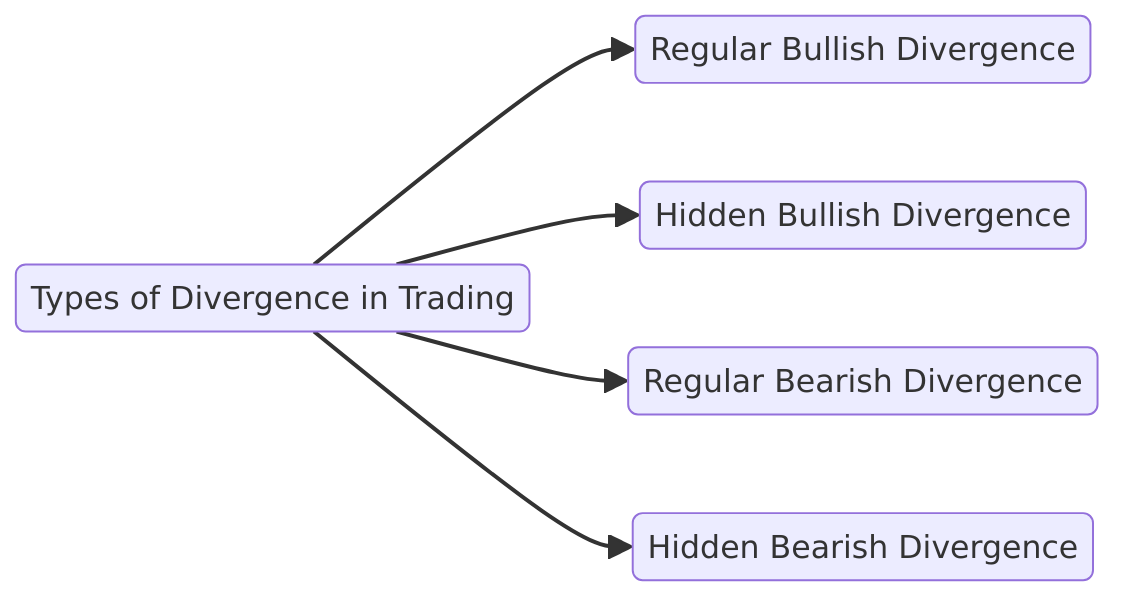
There are four basic types of divergence, each signaling different potential outcomes in market trends:
- Regular Bullish Divergence: Occurs when the price forms a lower low, but the indicator forms a higher low. This suggests weakening bearish momentum and a potential upward reversal.
- Hidden Bullish Divergence: Happens when the price makes a higher low, while the indicator forms a lower low. This indicates a likely trend continuation in an existing bullish trend.
- Regular Bearish Divergence: Appears when the price reaches a higher high, but the indicator shows a lower high. This divergence warns of a potential downward trend reversal.
- Hidden Bearish Divergence: Occurs when the price forms a lower high, but the indicator forms a higher high. This is a sign that the current bearish trend may continue.
Indicators for Detecting Divergence
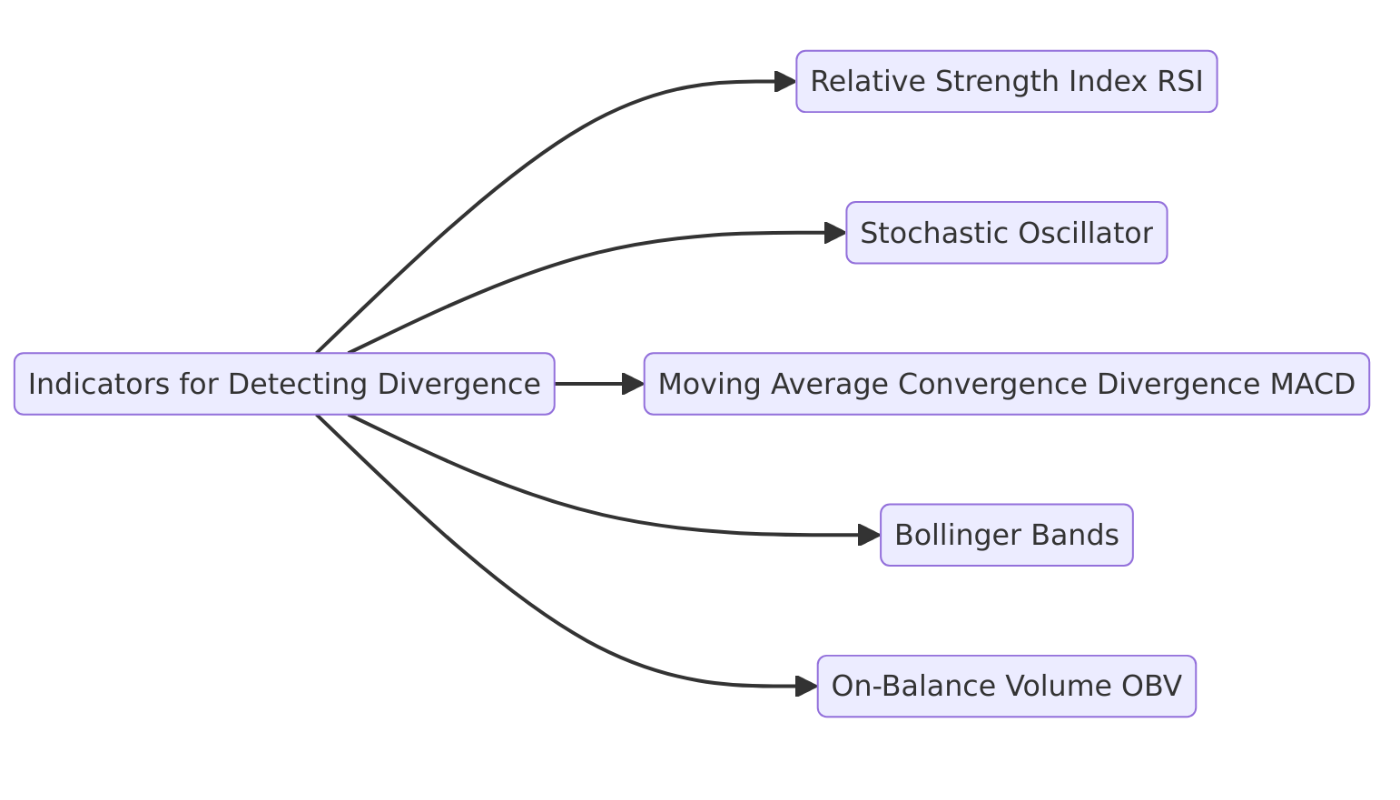
Indicators play a crucial role in detecting divergence in trading. Here are some key indicators used for identifying divergence:
- Relative Strength Index (RSI): The RSI is a momentum oscillator that measures the magnitude of recent price changes to determine overbought or oversold conditions. It is commonly used to identify divergence between the price action and the RSI. When the price makes a new high or low that is not confirmed by the RSI, it signals a potential reversal.
- Stochastic Oscillator: The Stochastic Oscillator is a momentum indicator that compares the closing price of a security to its price range over a given period. It is used to identify overbought and oversold conditions and to detect divergence. When the price makes a higher high or lower low that is not matched by the Stochastic Oscillator, it indicates a possible trend reversal.
- Moving Average Convergence Divergence (MACD): The MACD is a trend-following momentum indicator that shows the relationship between two moving averages. It is used to identify divergence between the MACD line and the signal line. When the price action diverges from the MACD, it can signal a potential change in trend direction.
- Bollinger Bands: Bollinger Bands are a volatility indicator that consists of a moving average and two standard deviations plotted above and below it. They are used to identify divergence between the price action and the bands. When the price moves outside the bands but the indicator does not, it can signal a potential reversal.
- On-Balance Volume (OBV): The OBV is a momentum indicator that measures buying and selling pressure by comparing the volume on up days to the volume on down days. It is used to identify divergence between the OBV and the price action. When the price makes a new high or low that is not confirmed by the OBV, it suggests a potential reversal.
These indicators can be used individually or in combination to detect divergence and identify potential trading opportunities.
Regular Bullish
Regular divergences are used as a tool to indicate reversals. This EUR/USD monthly chart shows the price making a lower low during a two-day period. But the momentum in MACD and Stochastics didn’t correspond to that of the price action, making higher lows. This signals a possible reversal of the trend or at least a retrace of the downtrend.
Adding to this is the fact that the price was trading between 1.035 and 1.0450 for about two years, which means that the sellers couldn’t push it any lower for a very long time. Taking a long from around that level would give a good risk/return ratio.
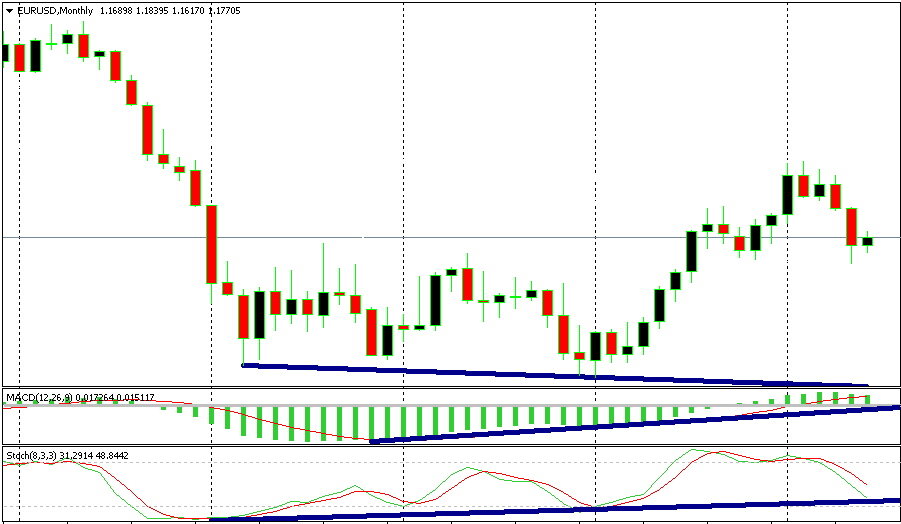
Regular Bullish Divergence – price is making lower lows while indicators are making higher lows. This indicates a coming reversal or retrace.
Regular Bearish
As we can see from the 4-hour chart, the price reached a high in the previous week and then made a higher high the following week. On the other hand, the MACD indicator at the bottom of the chart is making lower highs. This is called ‘Regular Bearish Divergence’ and indicates a fall in the price to come.
In this case, since we are in an uptrend, we should expect a retracement. After entering at the top, we should look to get out of the trade at the uptrend line.
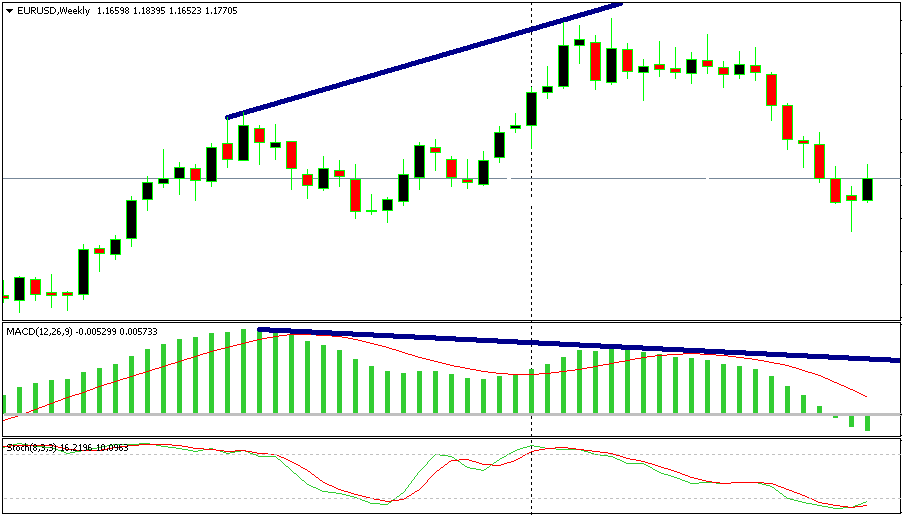
Regular Bearish Divergence – The price is making higher highs while MACD is making lower highs.
Hidden Bullish
Unlike regular divergence, hidden divergence indicates a continuation of the trend. This GBP/USD weekly chart shows several occasions where the price was making higher lows, while the stochastic was making lower lows. This divergence indicates that the retrace down is over and trend continuation is about to resume.
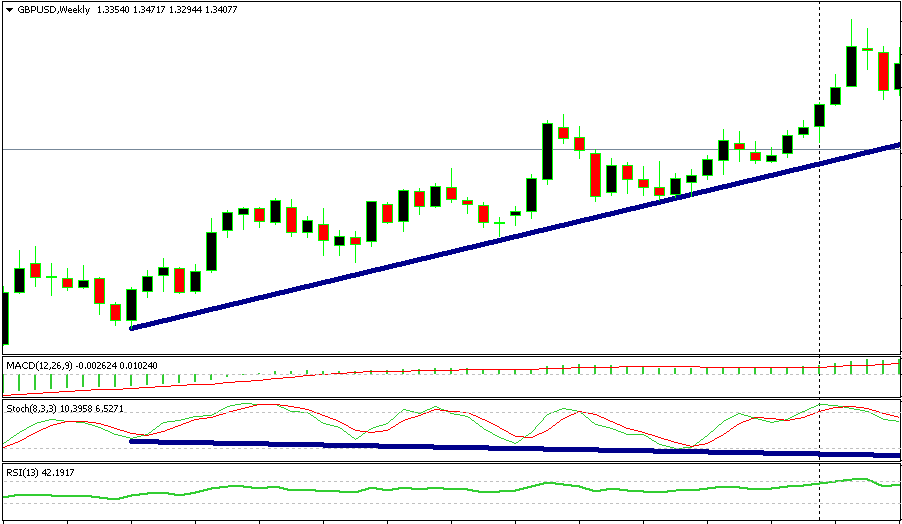
Hidden Bullish Divergence – unlike regular divergence, hidden divergence indicates the continuation of the trend.
Hidden Bearish
The daily EUR/USD chart below gives a clear example of hidden divergence and the trend reversal that follows. We can see that when stochastic was nearing overbought levels and had established divergence with the price which made lower highs, the pair fell immediately and began a downtrend.
This sort of chart pattern means that when the stochastic was overbought the second time, EUR/USD buyers couldn’t push any higher. So, the upside was complete even though EUR/USD couldn’t make new highs. This is a bearish reversing signal.
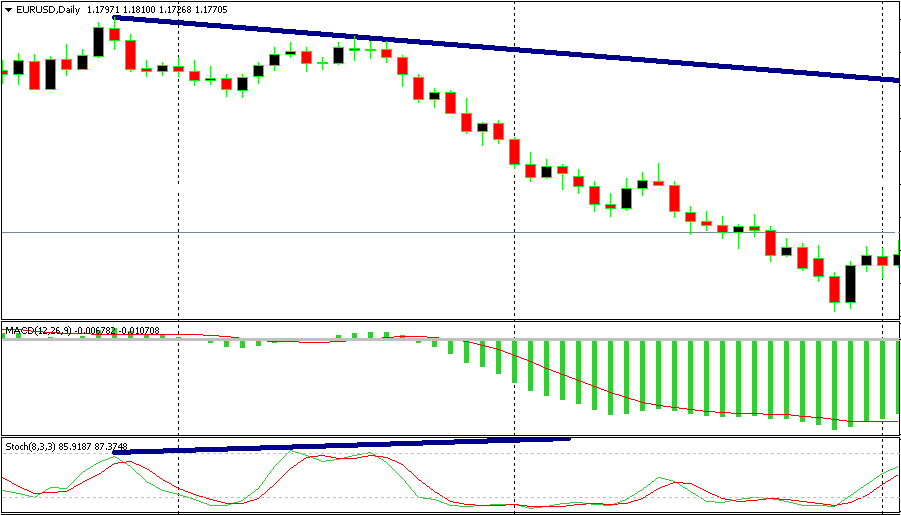
Hidden Bearish Divergence – when Stochastics are nearing overbought levels the pair falls immediately to continue the downtrend.
When Using Divergence Forex Strategies…
Divergence is quite easy to spot, as it only requires drawing a few lines. Nonetheless, sometimes we look too hard at the charts. This makes us see things that aren’t really there.
During periods of consolidation or low liquidity, small divergences between price and indicators might form — but that doesn’t mean we should consider them real divergences. The chart below shows a four-day consolidation period with indicators and the price not correlating exactly. However, this setup does not constitute a divergence.
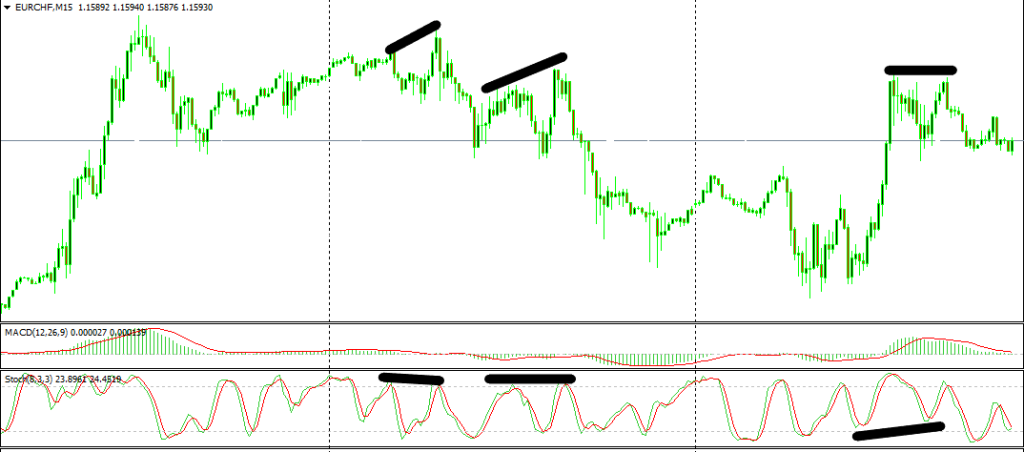
In consolidation periods not everything that looks like divergence is actually divergence — be careful.
Divergence is one of the best ways to use indicators to analyze charts. Alongside other support and resistance strategies, the divergence forex trading can be used to give your analytical skills the push they need to make you a very profitable trader. In our weekly analysis, our top Forex experts explain how they use divergence trading, alongside other Forex strategies to analyze the market’s actions every day.
Common Pitfalls to Avoid with Divergence
During periods of market consolidation or low liquidity, you may notice small divergences between price and indicators. While these might appear to signal a potential reversal, they often do not represent genuine divergence.
For example:
- In a sideways market, the price may fluctuate within a narrow range, causing indicators to behave erratically without clear correlation to price trends.
- This can lead to false divergence signals, especially when traders are eager to find setups that fit their expectations.
Key Tip: In consolidation periods, not every discrepancy between price and indicators qualifies as divergence. Always confirm signals with additional tools like trend lines, volume analysis, or support and resistance levels.
Why Divergence is an Essential Trading Strategy
Despite occasional false signals, divergence trading remains one of the most effective ways to analyze charts using indicators. It helps traders:
- Identify potential trend reversals before they’re visible in price action.
- Spot opportunities to enter trades early, increasing potential profits.
- Strengthen analysis when combined with other strategies like support and resistance or trendline analysis.
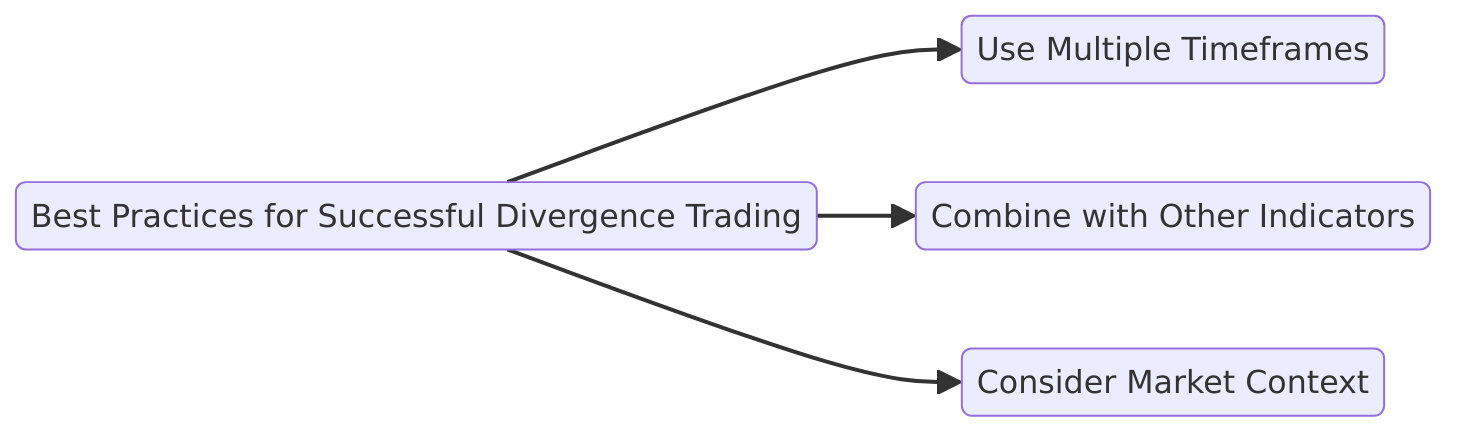
Best Practices for Successful Divergence Trading:
- Use Multiple Timeframes: Confirm divergence signals across different timeframes for more reliable results.
- Combine with Other Indicators: Validate divergence with tools like moving averages or stochastic oscillators.
- Consider Market Context: Always factor in broader market conditions, such as economic news releases or market sentiment.
Final Thought
Divergence trading strategies are not just about drawing lines—they’re about understanding the relationship between price momentum and market trends. By incorporating divergence into your trading toolkit and combining it with other technical analysis methods, you can enhance your ability to make informed, profitable trading decisions across all market conditions.
Frequently Asked Questions (FAQs)
1. What is divergence in trading, and why is it important?
Divergence occurs when the price of an asset moves in one direction while a technical indicator (like RSI or MACD) moves in the opposite direction. This discrepancy can signal a potential trend reversal or a continuation of the current trend. Divergence is important because it helps traders identify early signs of market shifts, allowing them to make timely entry and exit decisions.
2. What are the main types of divergence in Forex trading?
There are four key types of divergence in trading:
- Regular Bullish Divergence: Indicates a potential uptrend reversal when the price makes lower lows, but the indicator forms higher lows.
- Regular Bearish Divergence: Signals a possible downtrend reversal when the price makes higher highs, but the indicator shows lower highs.
- Hidden Bullish Divergence: Suggests a trend continuation during an uptrend, where the price forms higher lows, but the indicator makes lower lows.
- Hidden Bearish Divergence: Indicates a continuation of a downtrend, with price making lower highs while the indicator forms higher highs.
3. Which indicators are best for spotting divergence?
Some of the most effective indicators for identifying divergence include:
- Relative Strength Index (RSI): Highlights shifts in momentum and identifies overbought or oversold conditions.
- Moving Average Convergence Divergence (MACD): Tracks changes in trend strength and momentum.
- Stochastic Oscillator: Detects momentum shifts and helps confirm divergence signals.
- On-Balance Volume (OBV): Measures buying and selling pressure, confirming divergence through volume analysis.
4. How can I avoid false divergence signals?
To minimize false divergence signals, consider the following tips:
- Use Multiple Timeframes: Confirm divergence on both shorter and longer timeframes for better accuracy.
- Combine with Other Tools: Validate divergence with additional technical tools like trendlines, support and resistance levels, or volume indicators.
- Watch for Market Context: Be cautious during consolidation periods or low-liquidity conditions, where false signals are more common.
5. Is divergence trading effective on its own, or should it be combined with other strategies?
While divergence trading is a powerful strategy, it’s most effective when combined with other technical analysis tools. For example, using divergence alongside moving averages, trendlines, or support and resistance levels can help confirm signals and reduce the risk of false entries. Incorporating these strategies enhances your ability to make informed trading decisions in various market conditions.
Sidebar rates
Ava

