Gold Price Forecast: Will Symmetrical Triangles Spark a Move to Key Support Levels?
Gold spot is in serious structural consolidation and has pulled back slightly at $4,520.42, down 0.05% from its last close...

Quick overview
- Gold spot is currently consolidating at $4,520.42, showing a slight decline of 0.05%.
- The market is influenced by a hawkish stance from the new Fed Chair Warsh and rising real yields, eliminating expectations for near-term interest rate cuts.
- China's central bank continues to buy gold, maintaining strong demand and limiting price corrections in the spot market.
- Technical analysis indicates a potential for a significant price movement as gold remains in a compressed symmetrical triangle pattern.
Gold spot is in serious structural consolidation and has pulled back slightly at $4,520.42, down 0.05% from its last close. The precious metal is taking shape on the 2H chart as a symmetrical triangle pattern while the price has been coiling near the near apex since geopolitical risk premiums have started to unwind and global central banks have resumed long term gold hoarding.
Today’s Drivers
The new Fed Chair Warsh has solidified a hawkish monetary stance as central banks have continued to move their policy stances to increase real yields. The April CPI print hit 3.8% which eliminated most near term expectations for interest rate cuts. Meanwhile, institutions’ appetite for purchasing physical gold bullion as a hedge against global fiat currency debasement has been endless with the biggest buyers being China.
China’s central bank has been buying gold for 17 consecutive months and it continues to eat through all available floating supply on the spot market to minimize any price corrections. The conditional US-Iran cease-fire is now on week 8 with oil flow returning to normal with no short term disruptions in the Strait of Hormuz.
Gold Technical Analysis
Gold spot has a very obvious, highly compressed continuation pattern on the 2H chart. The price is holding onto the rising lower trendline at $4,520.42, which has served as green support after the recent push against red resistance from the upper counter-trendline.
Sellers are still firmly in charge throughout the duration of the consolidation pattern which was initiated and sent spot gold to the major area of demand around $4,500 to $4,520. The RSI sits at a neutral 41.52, which is below the 50 mid-line of the scale, which means there is a bearish bias but no deep oversold condition yet.
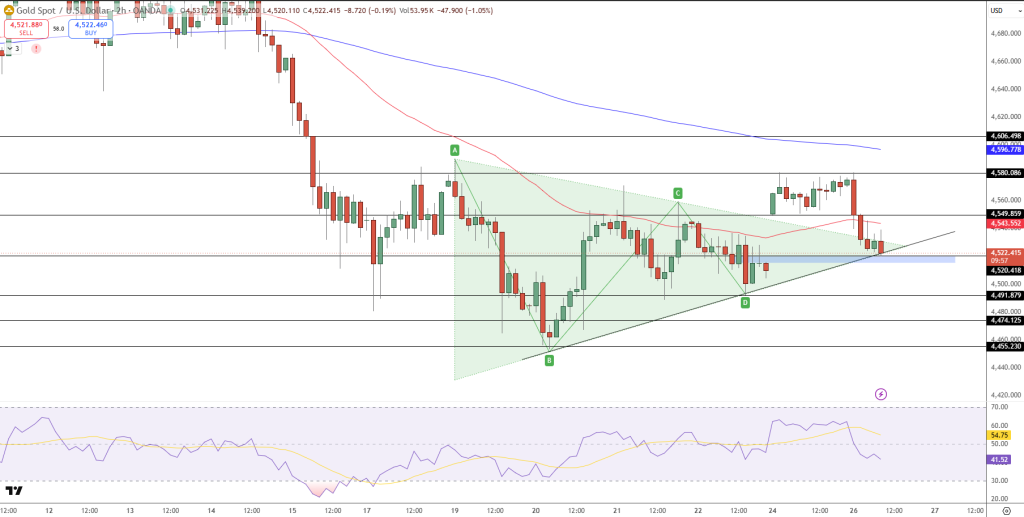
With the spot gold price stuck in between a bigger downtrend line which cased upside momentum to break above $4,606 and significant support below, the buildup for an explosive triangle breakdown continues to gather.
Resistance Zones: $4,543, $4,549 (top of the symmetrical triangle), and $4,606 (swing high) Support Zones: $4,520 (trendline), $4,500 (psychological level), and $4,474 (long term demand area)
Gold Trade Plan
The tight consolidation of the spot price at the near apex of the pattern provides a ready to execute trade setup:
Sell Stop Order: On the 2H candlestick closing below $4,500 Targets: $4,474 (T1) and $4,450 (T2) Stop Loss: Above the overhead swing high at $4,543
Analysis
Our short term technicals for gold indicate the bullion shakeout is almost done as we sit down for a $70 to $120 move. The Fed Chair Warsh’s new hawkish policy is weighing on price action as a near term ceiling, while the central bank forecasts of gold prices climbing to $5,400 to $6,300 remain intact on the weekly chart. We expect to see more consolidation or continued selling pressure ahead of the release of the monthly retail sales data from the US. We’ll keep monitoring for volume expansion on the symmetrical triangle setup.
- Check out our free forex signals
- Follow the top economic events on FX Leaders economic calendar
- Trade better, discover more Forex Trading Strategies
- Open a FREE Trading Account
- Read our latest reviews on: Avatrade, Exness, HFM and XM

Related Articles



Sidebar rates

Related Posts
 Save
Save