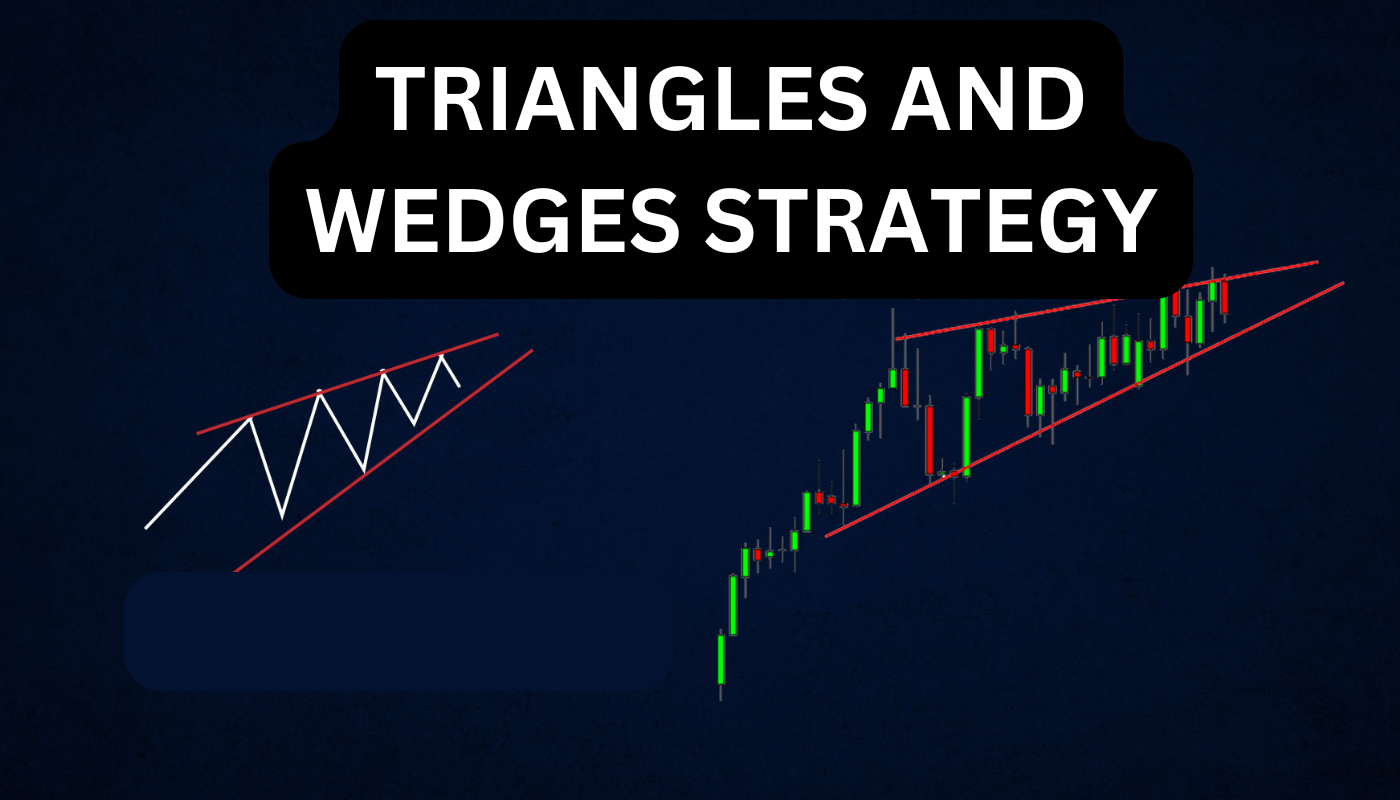
Triangles and Wedges Strategy
In technical analysis, triangles and wedges are among the top 10 most significant chart patterns that traders rely on to predict price movements.
While they differ slightly in formation and implications, their similarities make it practical to cover them together. This article will explain how to trade these patterns effectively, focusing on specific formations like the ascending triangle and the falling wedge.
Price rarely moves in a straight line. Instead, it forms trends with waves—rising, consolidating, and then moving again—similar to the principles outlined in the Elliott Wave Strategy. In an uptrend, for example, price surges (the first leg), consolidates, and then resumes its climb. The opposite occurs in a downtrend.
During consolidation phases, price often forms triangle or wedge patterns. To identify them clearly, switch to a smaller timeframe. For instance, if you’re trading on a 1-hour chart and notice consolidation, zoom into a 5- or 15-minute chart. Draw trend lines connecting the highs and lows within the range. A triangle forms when these lines converge toward a point, trapping price action within. A wedge, on the other hand, breaks out before the trend lines meet.
Introduction to Chart Patterns
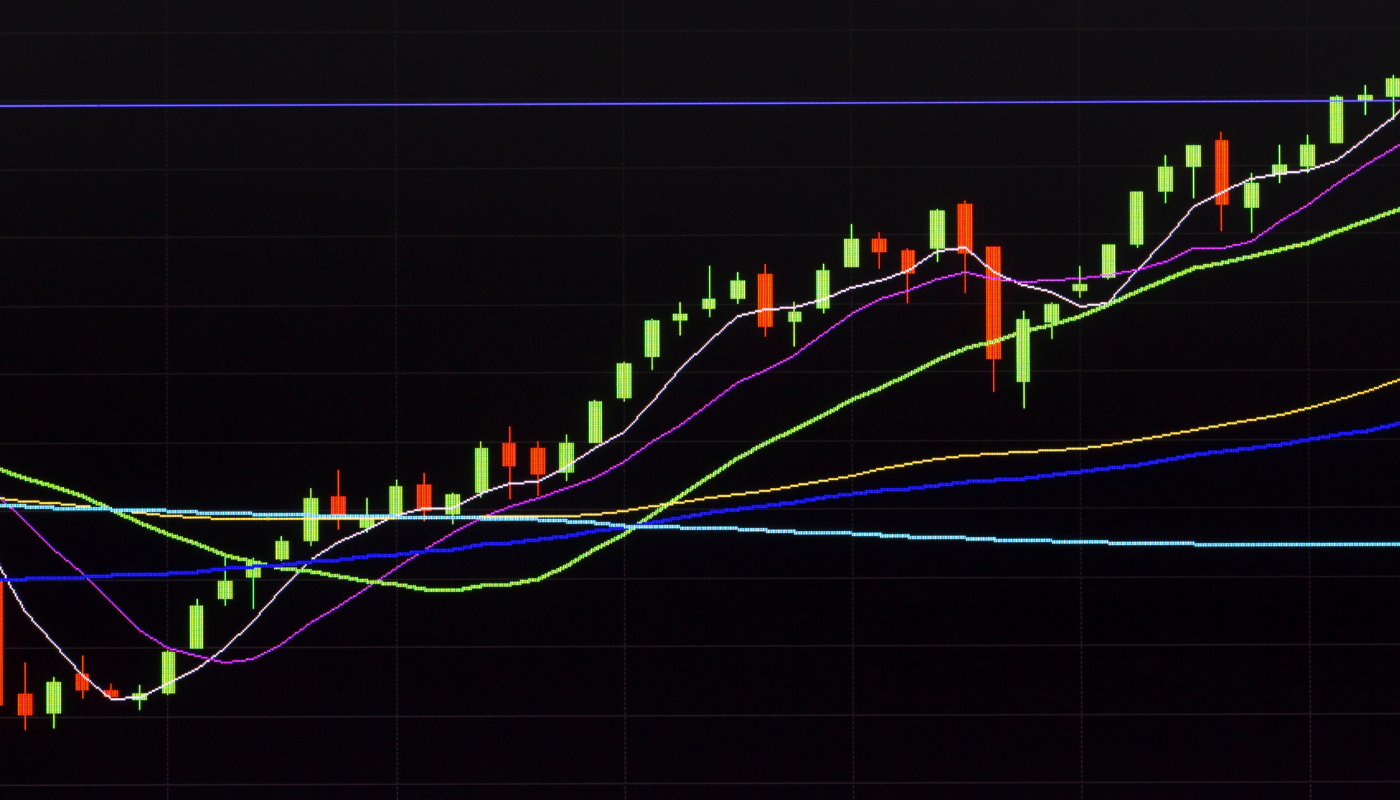
Chart patterns are a foundational element of technical analysis, offering traders valuable insights into market behavior. These patterns visually represent price movements, helping identify potential trading opportunities and predict future price actions. By studying the formation and structure of these patterns, traders can make data-driven decisions, enhancing their trading strategies.
Among the most reliable and commonly observed patterns are triangle patterns and wedge patterns. Both are critical tools for spotting trend continuations or reversals, signaling when a breakout or breakdown might occur. Recognizing these patterns allows traders to anticipate shifts in market sentiment, define entry and exit points, and manage risks effectively.
Mastering chart patterns is essential for any trader aiming to navigate the complexities of the financial markets with greater confidence and precision.
Understanding Triangle and Wedge Patterns
Triangle and wedge patterns are among the most common and effective chart patterns used in technical analysis. They help traders identify periods of consolidation, potential breakouts, and trend reversals. Here’s how they differ:
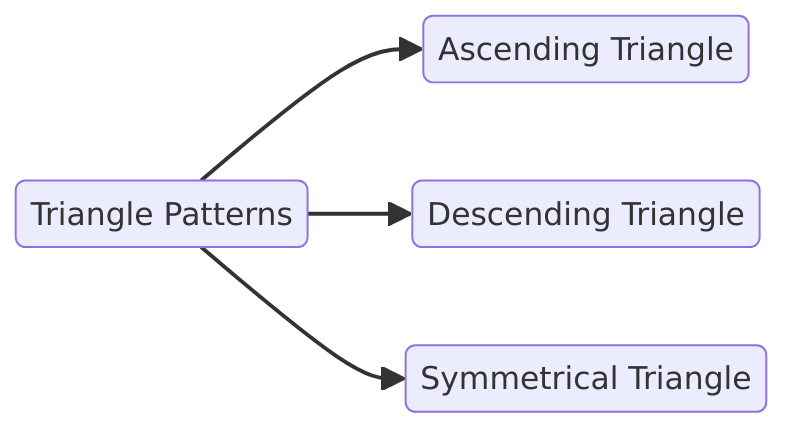
- Triangle Patterns: Characterized by converging trend lines that form a triangle shape, signaling a consolidation phase before a potential breakout. They come in three types:
- Ascending Triangle: Bullish bias with flat resistance and rising support.
- Descending Triangle: Bearish bias with flat support and descending resistance.
- Symmetrical Triangle: Neutral bias with converging trend lines, indicating potential breakouts in either direction.
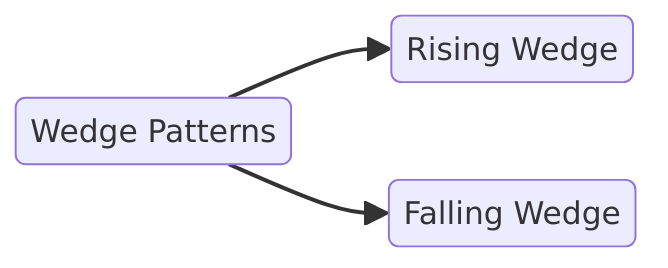
- Wedge Patterns: Formed by sloping trend lines converging to create a wedge shape, often signaling a reversal. These can be:
- Rising Wedge: Indicates bearish reversals.
- Falling Wedge: Suggests bullish reversals.
Both patterns help traders identify key support and resistance levels, as well as potential breakout points. The examples below illustrate how these patterns typically form on price charts.
Rising Wedge
A Rising Wedge is a bearish reversal pattern, marked by higher highs and higher lows within converging trend lines. Despite the upward price movement, the narrowing range indicates weakening bullish momentum.
Key Features:
- Converging trend lines sloping upwards.
- Volume typically decreases as the pattern forms.
- Breakout usually occurs to the downside.

Rising wedge
Trading Insights:
- Entry: Look for a breakout below the lower trendline.
- Stop-Loss: Place above the recent swing high.
- Target: Measure the widest part of the wedge and project it downward from the breakout.
This pattern can appear in both uptrends (as a reversal) and downtrends (as a continuation).
Ascending Triangle (Asymmetrical Rising Wedge)
The Ascending Triangle is a bullish continuation pattern, often leading to an upward breakout. It forms with a flat resistance line and rising support, showing strong buying pressure.
Key Features:
- Horizontal resistance with ascending support.
- Volume typically decreases before the breakout.
- Breakout often occurs above the resistance with increased volume.
Trading Strategies:
- Range Trading: Buy at higher lows, sell near the resistance.
- Breakout Trading: Enter long positions after a confirmed breakout above the resistance line, supported by strong volume.

Asymmetrical rising wedge
Descending Triangle
A Descending Triangle is a bearish continuation pattern, indicating selling pressure. It features a flat support line and a descending resistance line, suggesting that sellers are becoming more aggressive.
Key Features:
- Flat support with descending highs.
- Volume decreases as the pattern forms.
- Breakout typically occurs below the support line.

Descending triangle
Trading Approach
- Entry: Short positions after a confirmed breakdown below support.
- Stop-Loss: Place just above the descending trendline.
- Profit Target: Measure the height of the triangle and apply it below the breakout point.
Ascending Wedge/Triangle

The price is forming an ascending wedge

Price breaks the top line which turns into resistance
Descending Wedge/Triangle
The descending wedges and triangles are the opposite of the ascending ones and become valid after a downtrend. So instead of selling after the break of the bottom line, you buy after the top line gives way.
When you trade these patterns, the profit target you aim for should be as big as the space between the first top and the first bottom of the range, as shown in the second chart below.
The reason I´m saying the first top and the first bottom is because there are occasions when neither of the two lines of the wedge is horizontal, like the ascending one above.

Price Breaks Higher After an Ascending Wedge
During the Symmetrical Wedge/Triable formations, the bulls and the bears are putting up a bitter fight, until one side eventually gives up. It doesn´t matter if this consolidation takes place after an uptrend or a downtrend. When you use ascending and descending wedge or triangle chart patterns for trading, you know which way the price will go after the breakout, but symmetrical wedges and triangles don´t give you a clear direction.
Symmetrical Wedge/Triangle

In a symmetrical triangle, you can trade between the two lines and after the breakout
That doesn´t mean you cannot trade them though; you can trade them in the same way you trade rising and falling wedges/triangles. You buy and sell while the price is bouncing inside the two lines of the triangle. And of course, you can trade the breakout in either side by placing a stop buy or a stop sell order above and below the triangle.
I personally fancy opening a trade after the price breaks and retests one of the lines.
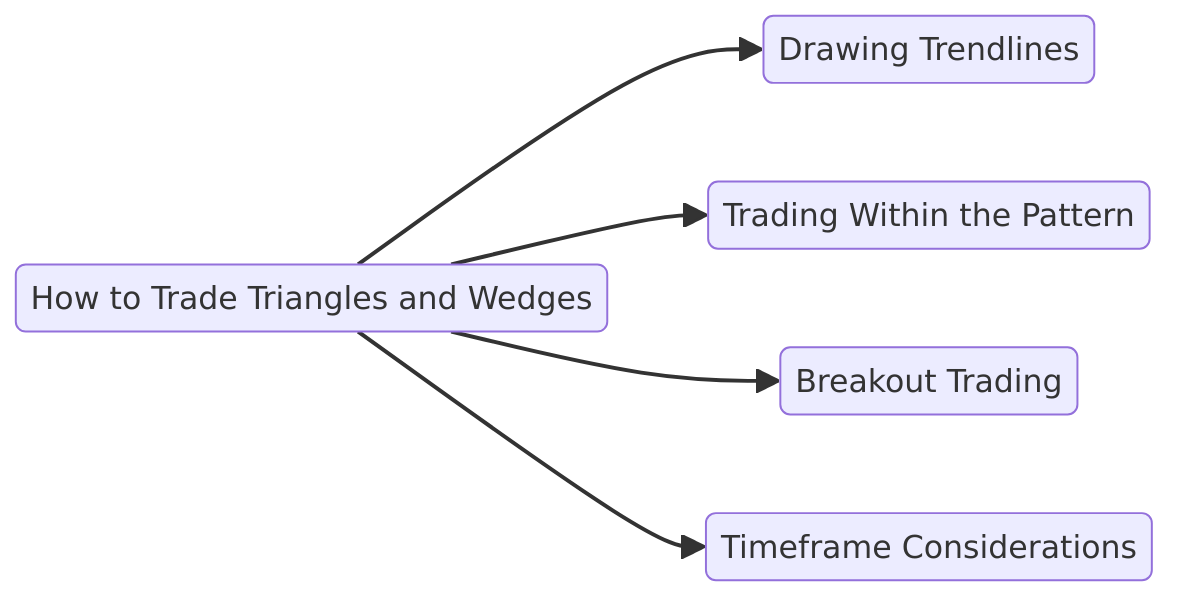
How to Trade Triangles and Wedges
You can start trading a wedge or triangle even as it’s forming. Here’s how:
- Drawing Trendlines:
- Resistance Line: Draw after identifying two swing highs.
- Support Line: Draw after identifying two swing lows (the second low should be higher for an ascending triangle/wedge).
- Trading Within the Pattern:
- Sell: Near the resistance with a stop-loss above it.
- Buy: Near the support with a stop-loss below it.
- Breakout Trading:
- Trade in the direction of the breakout.
- Confirm with volume spikes for stronger signals.
- Timeframe Considerations:
- Higher Timeframes (Daily/4H): Better risk-reward ratio and larger price movements.
- Lower Timeframes: Require brokers with tight spreads and fast execution.
Sidebar rates
Ava

