Prices Forecast: Technical Analysis
For today, Chainlink is predicted to close at **$7.80**, with a range between **$7.60** and **$8.00**. Looking ahead to the week, the expected closing price is **$8.10**, with a range of **$7.80** to **$8.40**. The technical indicators suggest a cautious bullish sentiment, as the RSI is currently at **47.54**, indicating a neutral trend but leaning towards bullishness. The ATR of **0.3611** suggests moderate volatility, which could lead to price fluctuations within the predicted range. The price is currently trading just below the pivot point of **$7.64**, which may act as a resistance level. If Chainlink can break above this pivot, it could signal further upward momentum. However, the presence of resistance levels at **$7.96** and **$8.22** could limit immediate gains. Overall, the combination of these indicators suggests a potential for upward movement, but traders should remain vigilant for any bearish reversals.
Fundamental Overview and Analysis
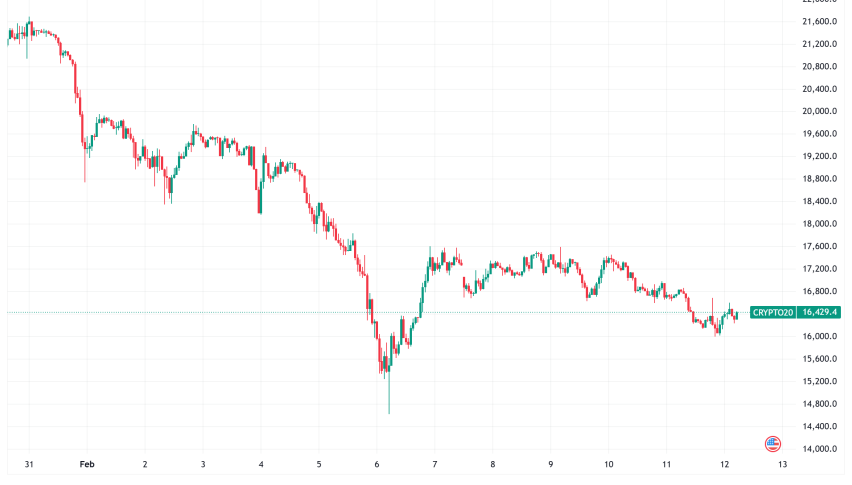
Chainlink has recently experienced a downward trend, with the price dropping from highs above **$13** earlier this year to the current level of **$7.698**. This decline can be attributed to broader market conditions, including regulatory scrutiny and fluctuating investor sentiment towards cryptocurrencies. The upcoming economic data, particularly the retail sales figures from Italy, could influence market behavior, as positive results may bolster confidence in the crypto market. Additionally, Chainlink’s unique position in the decentralized finance (DeFi) space continues to attract interest, with potential for future growth as more projects integrate its oracles. However, competition from other blockchain solutions poses a risk, as does the overall volatility of the crypto market. Currently, Chainlink appears to be undervalued compared to its historical performance, suggesting a potential buying opportunity for investors looking for long-term gains.
Outlook for Chainlink
The future outlook for Chainlink remains cautiously optimistic, with potential for recovery in the coming months. Current market trends indicate a gradual shift towards bullish sentiment, especially if Chainlink can maintain its price above the pivot point. In the short term (1 to 6 months), prices could stabilize between **$8** and **$10**, depending on market conditions and investor sentiment. Over the long term (1 to 5 years), Chainlink’s growth prospects are promising, particularly as the demand for decentralized oracles increases. However, external factors such as regulatory changes and market volatility could significantly impact its price trajectory. Investors should keep an eye on technological advancements and partnerships that could enhance Chainlink’s utility and adoption. Overall, while there are risks, the potential for Chainlink to regain its previous highs exists, making it a compelling asset for long-term investment.
Technical Analysis
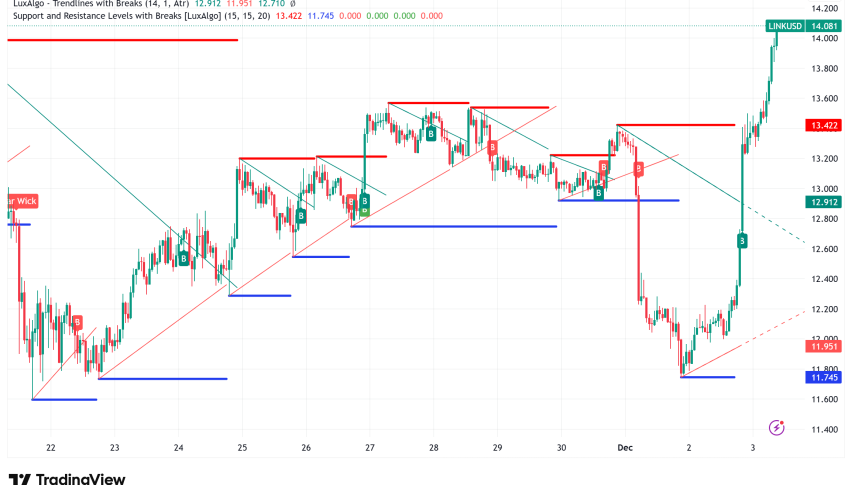
**Current Price Overview:** The current price of Chainlink is **$7.698**, which is slightly lower than the previous close of **$7.698**. Over the last 24 hours, the price has shown slight volatility, with a notable candle pattern indicating indecision among traders.
**Support and Resistance Levels:** The key support levels are **$7.37**, **$7.05**, and **$6.79**, while resistance levels are at **$7.96**, **$8.22**, and **$8.55**. The pivot point is **$7.64**, and since the price is currently below this level, it suggests a bearish sentiment in the short term.
**Technical Indicators Analysis:** The RSI is at **47.54**, indicating a neutral trend with potential bullish momentum. The ATR of **0.3611** suggests moderate volatility, while the ADX is at **22.4263**, indicating a weak trend. The 50-day SMA is currently at **9.7055**, and the 200-day EMA is at **9.8804**, showing no crossover yet, which suggests that the price is still in a downtrend.
**Market Sentiment & Outlook:** Sentiment appears to be bearish as the price is trading below the pivot point, and the RSI is not in the overbought territory. However, if the price can break above the resistance levels, it may shift sentiment towards bullish.
Forecasting Returns: $1,000 Across Market Conditions
The table below outlines potential investment scenarios for Chainlink, providing insights into expected price changes and estimated values for a $1,000 investment under different market conditions.
| Scenario | Price Change | Value After 1 Month |
|---|---|---|
| Bullish Breakout | +10% to ~$8.47 | ~$1,100 |
| Sideways Range | 0% to ~$7.70 | ~$1,000 |
| Bearish Dip | -10% to ~$6.93 | ~$900 |
FAQs
What are the predicted price forecasts for the asset?
The predicted daily closing price for Chainlink is **$7.80**, with a range between **$7.60** and **$8.00**. For the weekly forecast, the expected closing price is **$8.10**, ranging from **$7.80** to **$8.40**.
What are the key support and resistance levels for the asset?
The key support levels for Chainlink are **$7.37**, **$7.05**, and **$6.79**. The resistance levels are at **$7.96**, **$8.22**, and **$8.55**, with a pivot point at **$7.64**.
What are the main factors influencing the asset’s price?
Factors influencing Chainlink’s price include market sentiment, regulatory developments, and its unique position in the DeFi space. Additionally, upcoming economic data, such as retail sales figures, could impact investor confidence.
What is the outlook for the asset in the next 1 to 6 months?
In the short term, Chainlink’s price is expected to stabilize between **$8** and **$10**. This outlook is contingent on market conditions and the ability to maintain prices above key support levels.
What are the risks and challenges facing the asset?
Risks for Chainlink include competition from other blockchain solutions, market volatility, and potential regulatory hurdles. These factors could impact its price trajectory and overall market performance.
Disclaimer
In conclusion, while the analysis provides a structured outlook on the asset’s potential price movements, it is essential to remember that financial markets are inherently unpredictable. Conducting thorough research and staying informed about market trends and economic indicators is crucial for making informed investment decisions.