Gold Price Forecast: $4,200 Target Eyes Trendline Defense as Switzerland Pact Finalized Post-FOMC
Gold Price Forecast: Spot gold stabilizes at $4,168 as the formal signing of the Switzerland Peace Pact safely drains safe-haven premium out

Quick overview
- The global bullion market is experiencing low trading volumes in paper contracts as spot gold prices stabilize at $4,168.14 per ounce.
- The recent U.S.-Iran interim accord has alleviated geopolitical risks, contributing to a decline in Brent crude oil prices and easing inflation concerns.
- Gold remains supported by sustained accumulation from the People's Bank of China and ongoing debt challenges in the Eurozone.
- Technical analysis indicates that gold is at a critical support level, suggesting potential for a rebound despite a challenging macro environment.
The global bullion market has executed an intense structural reset, driving paper contracts into multi-week low volumes. Spot gold prices staged a carefully orchestrated counter-move on Friday, June 19, 2026, in afternoon trade to hold the line at $4,168.14 per ounce.
As institutional macro traders update their models to factor in a changing international political landscape, long-term physical buyers are increasing their bid at key long-term technical support levels.
In the immediate near-term, the main fundamental backdrop for this midday trading session was the formal signing of the U.S.-Iran interim accord known as the “Islamabad MoU.” A much-awaited diplomatic ceremony today in Switzerland confirmed broad U.S. recognition of the terms, which include the restart of Iranian oil exports, the opening of the strategic Hormuz Strait, and the lifting of the US naval blockade of Iran.
The completion of the historic agreement has effectively removed the last geopolitical tail risk that provided a significant floor for precious metals into spring. As a result, front-month Brent crude oil has dropped to a multi-month low under $80 per barrel, removing energy-driven headline inflation fears from the market.
This backdrop arrives at a critically important juncture given the results of this week’s FOMC meeting, the first under new Fed chairman Kevin Warsh. In line with his well-known philosophy as a hard-line, data-based monetarist, Chairman Warsh underscored the continued 4.1% core CPI, 6.5% PPI, indicating that the Fed will need to remain restrictive for an extended period of time and that rate-cut expectations will be heavily dampened through the autumn.
Such a hawkish signal has strengthened the U.S. dollar and real Treasury yields, setting up gold for a more challenging macro environment.
Gold Floor Underpins Bullion Amidst Risk Unwinding
Against the backdrop of a tighter central bank regime and a major reduction in tail risks in the Middle East, gold continues to be underpinned by its historic support levels due to:
- 17 months of sustained accumulation by the People’s Bank of China: The People’s Bank of China has sustained physical buying for the past 17 months, which has provided gold’s major price levels. Central banks in emerging markets are also increasing their physical gold reserves by offloading their dollar and treasury debt and moving into gold as a hedge against the massive dollar and debt expansion seen from the West.
- Persistent systemic sovereign debt and growth challenges in the Eurozone: These structural pressures continue to highlight the importance of gold’s portfolio function, as a non-sovereign asset class in times of fiscal crisis.
Gold (XAU.USD) Technical Analysis: Oversold Squeeze Tests Ascending Black Support
Leaving fast-moving diplomatic headlines aside and looking at the 2-hour chart, gold’s swift paper correction has rolled right into a high-conviction macro multi-month support node that makes for an interesting technical sandbox for swing traders.
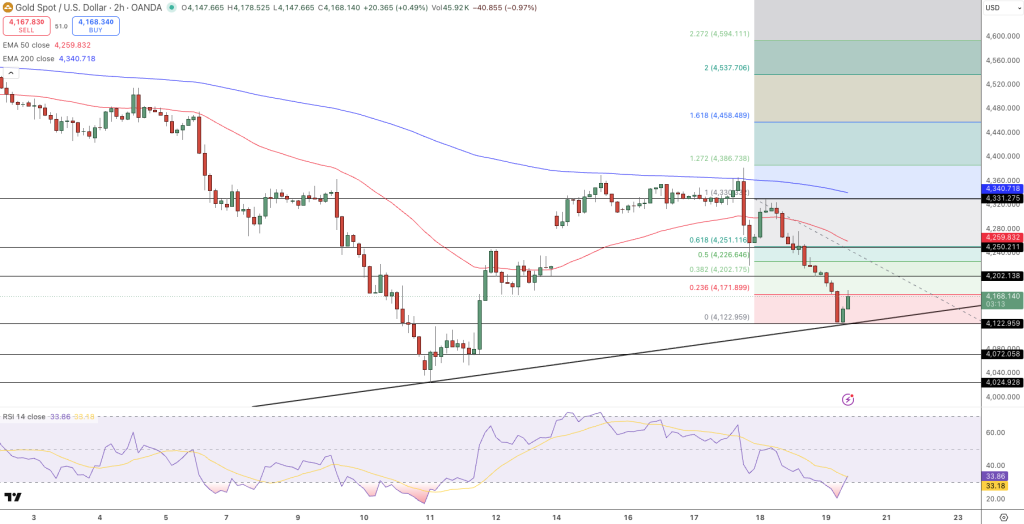
- Ascending Trendline Trap: Gold ($4,168.14) is mounting a technically significant defense along a primary ascending black support line even as price trades inside the dominant descending channel off the highs. Long lower shadows point to heavy buying into local lows.
- Extremely Discounted Moving Averages: This emphasizes the speed of the post-ceasefire dump as price trades deeply below both the 2H EMA50 ($4,259.83) and 2H EMA200 ($4,340.72) with both dynamic averages sloping down to create an overhead resistance stack.
- Extremely Oversold Exhaustion: The 14-period RSI prints an extremely exhausted oversold level of 33. Importantly, price action has been carving higher lows in the RSI rather than lower lows. A bullish momentum divergence is taking shape and signaling short-term selling exhaustion.
- Trade Execution Structure: High-probability tactics are outlined across two structural boundaries:
Bullish Rebound Trade Structure: Trade a long from the $4,168 technical support node on confirmed candlestick stabilization. Place a stop-loss order below the local swing low at $4,122.96 and look to target a sharp relief trade to the $4,202.18 0.382 Fibo level with a potential extension to the $4,251.12 technical confluence node on accelerating short-covering.
Bearish Breakdown Trade Structure: In the event that downstream global PMI prints high, trade a short beneath the local floor at $4,122.96 on a high-volume downside break. Place a stop-loss above $4,175 and target a rapid follow-through breakdown to the deep structural liquidity node at $4,072.06.
In conclusion, gold is executing a major structural transition. While a hardline Fed under Chair Warsh continues to keep paper gold extremely volatile heading into the near term, the confluence of historic 17-month sovereign demand on the physical bullion and deeply oversold 2H trendline support points to gold being primed for an intermediate technical rebound into the late-June macro cycle.
- Check out our free forex signals
- Follow the top economic events on FX Leaders economic calendar
- Trade better, discover more Forex Trading Strategies
- Open a FREE Trading Account
- Read our latest reviews on: Avatrade, Exness, HFM and XM
Related Articles


Sidebar rates
Related Posts
