Gold Price Forecast: $4,350 Breakout Pivot Eyes Rising Black Trendline Defense Post-FOMC
The international bullion market now finds itself in a calculated period of post-decision consolidation with a tight structure in place...

Quick overview
- The international bullion market is currently in a period of consolidation, with spot gold prices stabilizing around $4,268.73/oz following the recent FOMC meeting.
- Federal Reserve Chair Kevin Warsh's announcement maintained interest rates and eliminated expectations for rate cuts in 2026, emphasizing a need for a restrictive monetary stance due to high inflation.
- Key drivers for gold prices include a cooling risk premium from U.S.-Iran relations and ongoing accumulation of gold by central banks, particularly the People's Bank of China.
- Technical analysis indicates a potential for volatility in gold prices, with critical support and resistance levels identified for traders to watch.
The international bullion market now finds itself in a calculated period of post-decision consolidation with a tight structure in place for spot prices. On Thursday, June 18, 2026, spot gold prices found a solid, defensive floor during midday trading, settling at approximately $4,268.73/oz. Institutional macro desks seem content to stand on the sidelines while gauging the structural ramifications of a major hawkish shift in Washington as long-term physical buyers step in to pick up the distribution from the paper market.
The key fundamental driver for the current price floor is the official close of the June 16 to 17 FOMC meeting. The meeting marked the monetary inauguration of Federal Reserve Chair Kevin Warsh. A rules-based monetarist known as market disciplined, Warsh did not deviate from his typical data-dependant framework in his FOMC announcement.
The Federal Reserve kept rates on hold in the 3.50% to 3.75% range and, notably, removed remaining prospects for any rate cuts in the upcoming fall. In a significant update to its economic forecast, Warsh and the FOMC released an updated set of the FOMC Summary of Economic Projections (SEP) in the minutes from the meeting, which completely removes all remaining expectations for rate cuts in the fourth quarter of 2026.
Warsh’s comments acknowledged that inflation remains too high, citing 4.2% CPI year-over-year data and PPI figures of 6.5%, and that the central bank will need to maintain a restrictive stance on rates. His comments suggest that higher rates for longer will be required to sufficiently break sticky consumer expenditures. Rising long-dated Treasury yields continue to provide the green light for dollar buyers, while a persistent bid has been established for the U.S. Dollar Index, continuing to weigh on gold futures. With the major macro event in the rear-view mirror, structural floor support will be the next factor to watch.
Gold remains underpinned by a key set of physical drivers:
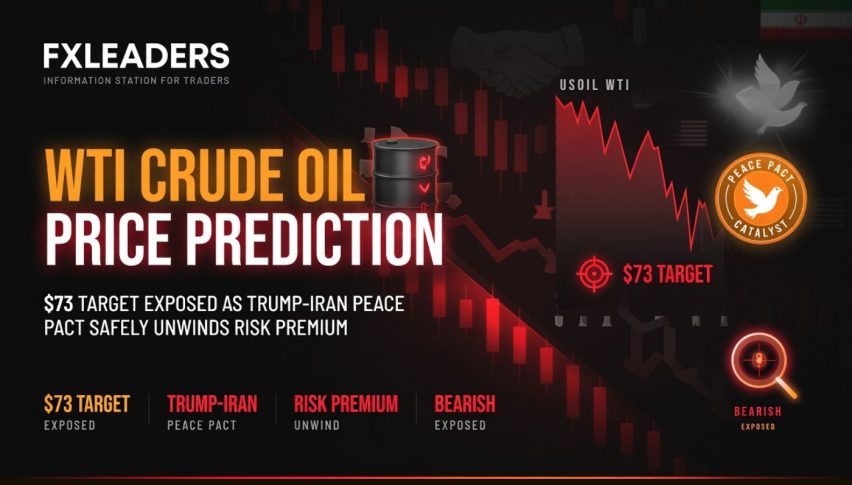
- The Swiss Treaty: Risk premiums are cooling off as the United States and Iran confirm their finalization of a peace memorandum of understanding that is due to be signed in Switzerland this Friday. The Strait of Hormuz has seen its shipping volume return to 85% of pre-crisis levels, which is further dampening speculative demand for short-term gold.
- Sovereign Demand: The fundamental structure of global central bank gold reserves remains intact, thanks in no small part to the continued 17-month campaign by the People’s Bank of China to fill its coffers with gold. Emerging-market central banks have followed China’s lead in accumulating gold, purchasing it by liquidating western securities as the latter are increasingly printing multi-trillions in debt.
Gold (XAU/USD) Technical Analysis: 2H Trendline Squeeze Signals Impending Volatility
Gold Technical Analysis: The 2H trendline squeeze means more volatility. Let’s ignore the Central Bank talk. Take a look at a 2H technical chart and note the compression of the technical structure that’s squeezing Gold at $4,268.73. This forms the foundation of a technical high probability tactical sandbox for swing traders.
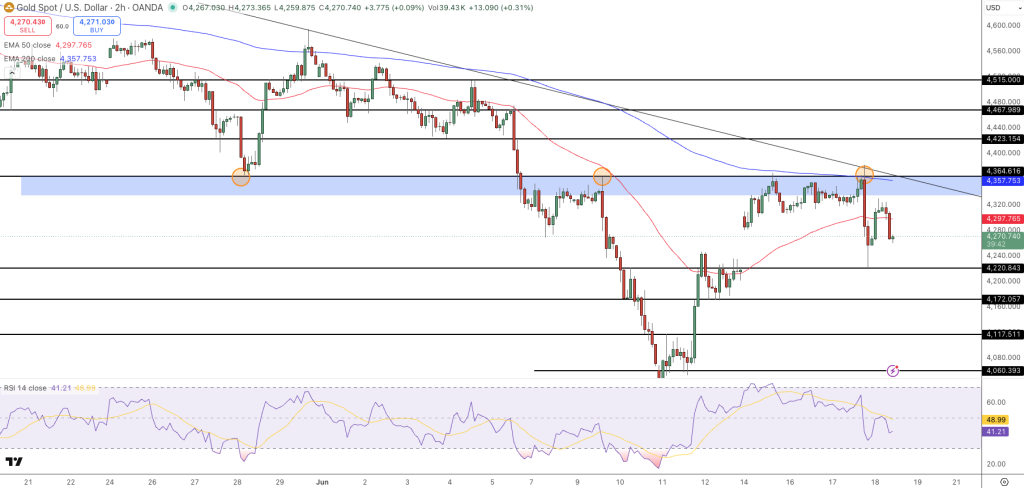
The rising black support trend line
Gold ($4,268.73) is holding a strict rising black support trend line. This line is acting as the primary dynamic floor against intense overhead supply cascading down from a dominant descending channel and the price is currently bouncing on the line to fight back against overhead pressure.
Overhead pressure from the descending channel from $4,652 is the biggest factor for resistance. The 50 EMA ($4,233) and the descending 200 EMA ($4,357) with macro trend line is the next level of resistance. Both are the main points of resistance as the next minor bounce in the price action would hit these levels and be rejected.
The Relative Strength Index (RSI 14) is still neutral (40 to 48). This is neutral price action. There is no sign of an overbought or oversold RSI. The fact that there’s no sign of an RSI indicates a lack of volume, a pre-breakout environment, which would mean a 2 hour candle close would likely lead to a large move (a $60 move on a $4,300 currency would be huge). Price could move in two directions.
Price action long: If you enter a long position at the next bounce you should wait for the close of the 2 hour candle at $4,357 to enter the position. The 200 EMA line and macro trend line would be reclaimed. You should place your stop loss order at $4,172 to protect your downside. You’d expect a continuation price move up to $4,428.
Price action short: If the market prints a high reading on the downstream data tomorrow morning, you should enter a short position at the next breakout under the rising black trend line $4,230. Place your stop loss order at $4,295 to protect your upside. You’d expect a continuation price move down to $4,117.
So the next week in price action is going to be a transition. As long as a hard line Federal Reserve continues (Chair Warsh) we can expect volatility in price action over the next few weeks. Gold has seen record levels of sovereign buying for 17 months in a row. Gold is still the asset for a defensive global macro hedge portfolio.
- Check out our free forex signals
- Follow the top economic events on FX Leaders economic calendar
- Trade better, discover more Forex Trading Strategies
- Open a FREE Trading Account
- Read our latest reviews on: Avatrade, Exness, HFM and XM
Related Articles


Sidebar rates
Related Posts
