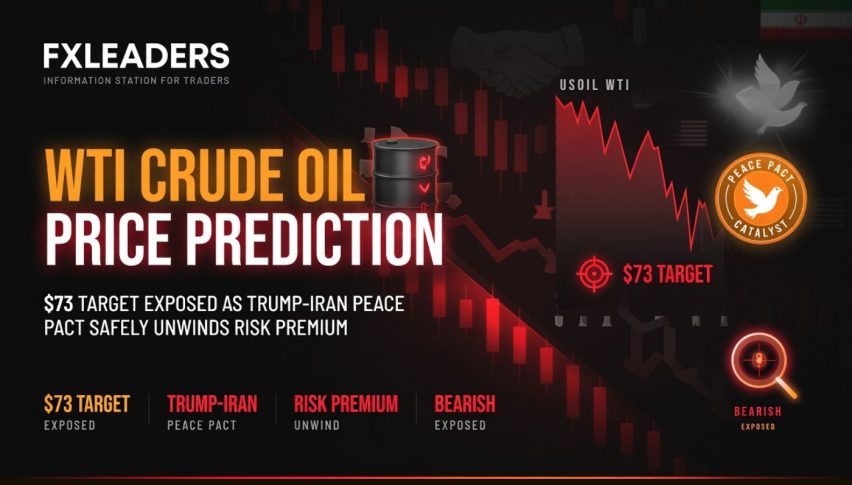
WTI Crude Oil Price Prediction: $73 Target Exposed as Trump-Iran Peace Pact Safely Unwinds Risk Premium
The global energy matrix has undergone an aggressive structural realignment, completely erasing its geopolitical insulation in real time.
Quick overview
- The global energy matrix has shifted dramatically, with geopolitical factors now directly influencing energy markets in real-time.
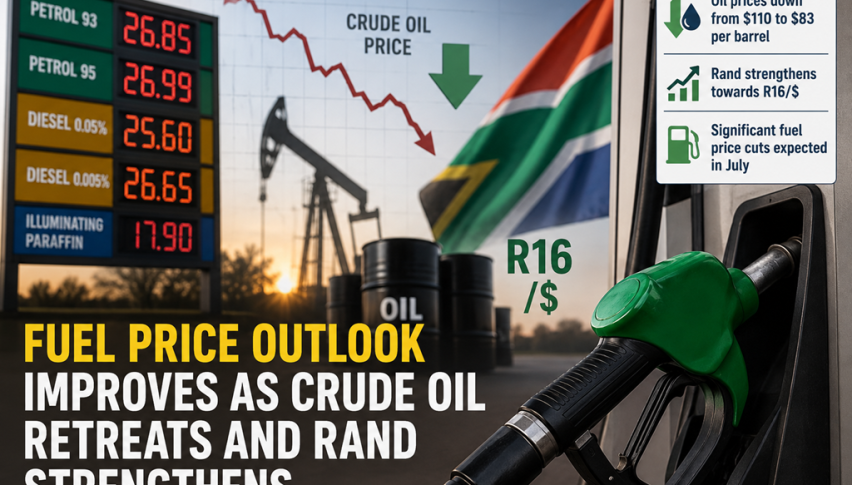
- WTI crude oil prices fell to $78.29/bbl following a diplomatic deal between the U.S. and Iran, which alleviated regional tensions.
- The International Energy Agency revised its 2026 global oil demand estimate down by 1.1 million bpd, indicating a worsening macro environment.
- Technical analysis shows WTI has broken below key support levels, suggesting a bearish outlook as supply increases from OPEC+ and U.S. shale.
The global energy matrix has undergone an aggressive structural realignment, completely erasing its geopolitical insulation in real time. In the course of a few days, it is becoming apparent that geopolitics and energy markets have finally ceased to function in real-time.
WTI crude oil fell on Wednesday, June 17, 2026, to touch $78.29/bbl. Energy desks are exiting long positions, dumping length as a stunning diplomatic deal out of Washington shifts market dynamics in a physical market in favor of a grossly oversupplied macro theme. The week’s big market event was the formal declaration by Donald J. Trump that an agreement with Tehran will be signed into a peace deal and memorandum of understanding this Friday in Switzerland, ending threatened military actions and beginning to open the Straits of Hormuz.
With the removal of a regional crisis and the geopolitical risk premium that had accrued over weeks, crude is down over 5% this week. It now trades as close to a bottom seen as early as March 2026. The deal is a step in a direction that restores roughly 85% of regional tanker traffic; however, it comes at what might be considered an exceptionally loose time in the global macro cycle.
The newly released June International Energy Agency (IEA) Oil Market Report was an absolute shock to the energy sector, with the IEA down-revisioning its 2026 global oil demand estimate by a hefty 1.1m bpd as a result of a worsening macro environment and longer substitution. The downward revision comes alongside an expanding supply curve in what appears to be a recipe for no fundamental support.
- The OPEC+ July Production Increase: A small group of OPEC+ nations led by Saudi Arabia and Russia voted on June 7 to raise the organization’s production quota by 188,000 bpd for July to phase out the voluntary supply cuts made by the alliance following the high-profile exit of the UAE from the active stabilization plan.
- Non-OPEC production remains at a level of record-high U.S. output and robust deepwater production in Guyana, Brazil, and Canada in an unprecedented level. Any local constraints will be overcome by a global supply surge.
- Monetarism is the Fed: The Federal Open Market Committee meets today, marking the first of many of the Federal Reserve’s meetings under the newly sworn-in Chairman Kevin Warsh. With the CPI coming in at a hot 4.2% for last month and PPI at an impressive 6.5%, a switch to hard monetarism is expected and supports the dollar, which will be another headwind for commodities priced in USD.
WTI Crude Oil Technical Analysis: Symmetrical Triangle Breakdown Extends Lower
Let’s ignore the rapid shifting of the diplomatic headlines, for a moment, and turn our attention to the 4H chart. The compression period has just been completed and has resulted in a textbook high-volume bearish breakdown for WTI that now gives institutional sellers absolute control in the tactical sense.
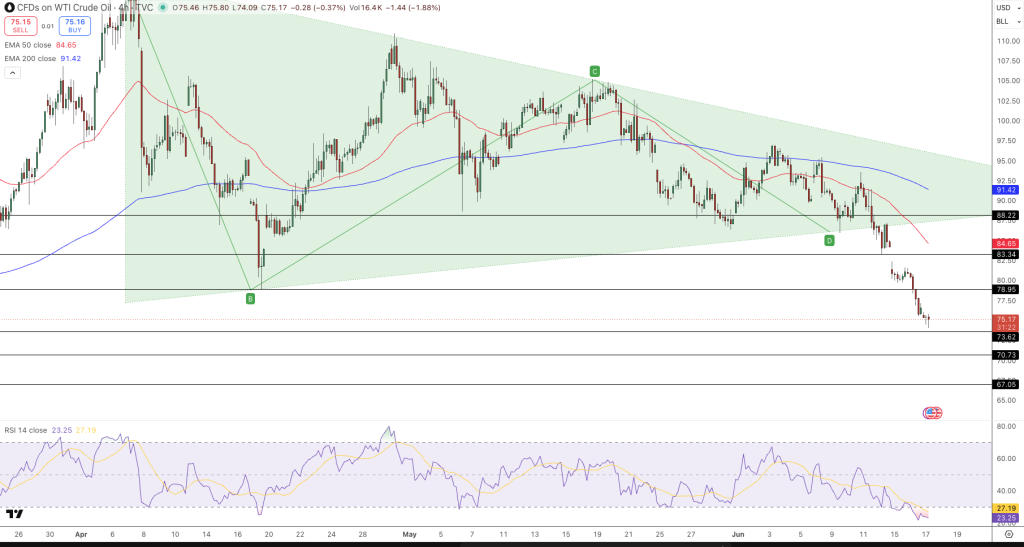
- The Triangle Apex Violation: WTI (78.29) has broken the lower ascending support trendline of a large symmetrical triangle (A-B-C-D) in a high volume move.
- The bearish move below this support line means the trend reversal of the intermediate-term has played out fully.
- Below Moving Averages: In the 4H chart price has fallen well below the 4H 50 EMA(84.65) and 4H 200 EMA (91.42) both sloping down in supply configuration as it was pushed back from the upper green boundary near the $91 to $96 zone.
- The RSI 4H 14(23) is oversold, but a distinct positive momentum divergence is forming against local price lows, which suggests higher risk of exhaustion in the short term from a support level.
Trading Idea:
- Shorts: The strategy for continuation short positions is to short minor counter-trend rallies (4H) towards the 78.00-79.00 support level broken, with a stop order above the 82.00 level, and a measured projection level of 73.62 with an extended move down to 71.03.
Crude Oil is returning to its cyclical and fundamental gravity. While any execution delays or compliance violations regarding the Trump-Iran verification process could inject short-term headline volatility back into the tape, the 188,000 bpd increase in OPEC+ supply + US shale record supply volumes mean WTI is deeply bearish as we head into the second half of 2026.
- Check out our free forex signals
- Follow the top economic events on FX Leaders economic calendar
- Trade better, discover more Forex Trading Strategies
- Open a FREE Trading Account
- Read our latest reviews on: Avatrade, Exness, HFM and XM
Related Articles
Sidebar rates
Related Posts
