Why Bitcoin Crashed 20% This Week After Michael Saylor’s Surprise Sale; Double Bottom to Drive Buy?
On Saturday, Bitcoin failed to halt its selling pressure and dropped even below $60,000. It is hitting the intra-day low of $59,192 level...

Quick overview
- Bitcoin dropped below $60,000, hitting an intra-day low of $59,192, marking its weakest performance since October 2024.
- The decline is attributed to ongoing Bitcoin ETF outflows and strong US job data, which may lead to delayed rate cuts by the Federal Reserve.
- Michael Saylor's Strategy company sold 32 Bitcoins for dividends, raising investor concerns despite still holding a significant amount of BTC.
- A double bottom pattern has formed on the daily chart, suggesting potential for a price rebound if key resistance levels are broken.
On Saturday, Bitcoin failed to halt its selling pressure and dropped even below $60,000. It is hitting the intra-day low of $59,192 level, which was seen as the weakest performance since October 2024. At the time we are writing this article, Bitcoin is trading at the $60,886 level, showing 1.79 percent losses in the last 24 hours and a 20 percent crash so far this week.
Bitcoin price is being pressured by several factors. One of them is Bitcoin ETF outflows, which have been continuing for the past 14 days and have shown an estimated $5 billion loss. In addition to this, strong US job data that was recently released has also negatively impacted the crypto market because positive data makes investors think that maybe the Federal Reserve will delay rate cuts or might move towards rate hikes. In this way, when the chances of rate cuts are delayed, riskier assets like Bitcoin and other crypto coins are negatively affected.
Strategy Sells Bitcoin for Dividends
Michael Saylor’s Strategy company sold 32 Bitcoins worth $2.5 million at the time of sale, and this has made investors suspicious and raised questions about why this company did it. According to a US SEC filing, these BTC were sold between May 26 and 31, and at that time the BTC price was $77,135. The market may have also been shocked because this company sold Bitcoin for the first time since 2022, and when such activity happens after such a long time, everyone gets surprised, because Strategy holds coins for the long term in the market.
According to the company’s statement, they did this sale to accumulate funds so that they can make dividend (profit) payments to their preferred stock holders. But the thing that matters more is that they still have a very large number of BTC, almost 843,706 BTC, worth about $63.87 billion. Even though it was only a small amount of BTC, this step still put pressure on BTC at a time when BTC was already falling due to weak demand and heavy ETF outflows.
Strong US Jobs Hit Bitcoin
On Friday, according to the report of the U.S. Bureau of Labor Statistics, the U.S. jobs data came out very strong, and it beat analysts’ expectations. According to the report, U.S. non-farm payrolls increased by 172,000 in the month of May, and Wall Street had estimated that this data would be 85,000, but it turned out to be much higher by a large margin, and this is being considered very good. On the other hand, the U.S. unemployment rate remained the same as before at 4.3%, which is a good thing and shows that the U.S. labor market is strong.
But this report has had a negative impact on BTC because when U.S. data, especially labor data, comes in strong, it increases the chances that the Federal Reserve may delay rate cuts or even move towards rate hikes instead. According to BNP Paribas estimates, the U.S. Federal Reserve could implement three rate hikes, which is bad news for the crypto market and weakens crypto. After this data, Bitcoin fell sharply from $62,500 to $59,000.
BTCUSDT Daily Chart: Double Bottom Pattern Completes at Key Fibonacci Support
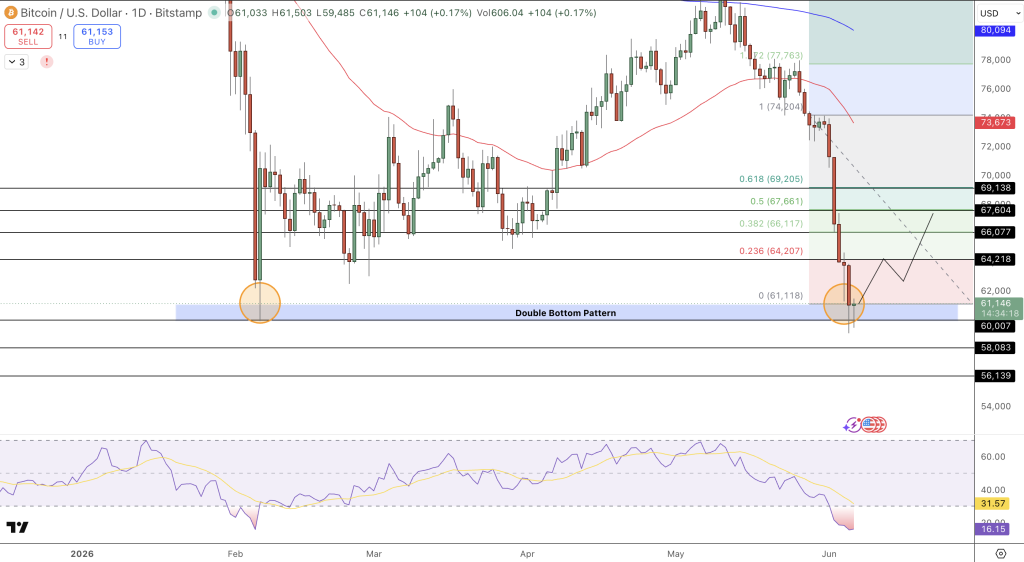
Bitcoin ($61,146) just completed a classic double bottom on the daily chart, with the two orange circles indicating two distinct higher lows in the major horizontal $61,118 support area. After multiple tests of the double bottom, seller momentum seems to have dried up. The double bottom is still below the red descending trend line and dynamic MAs, but the double bottom formed right at 0 Fib is providing a really bullish confluence for a higher low.
Fibonacci levels are a 0.236 ($64,207), 0.382 ($66,117) resistance, and if the double bottom neckline is broken, there will be targets of 0.5 ($67,661), 0.618 ($69,205) and 1.0 ($74,204) resistance. If the 1×1 (1 to 1) pattern of the double bottom is confirmed, we should see upside to $74-77k. RSI 14 is at 31.57 and looks oversold at $61k lows with bullish divergence. We have also been watching the volume in the green candles at the lows.
The double bottom near a major Fibonacci support at a macro descending channel suggests a possible trade setup after a major sell off. Fibonacci level and momentum indicators are all suggesting that once the immediate resistance is crossed, we should see price action in higher lows for Bitcoin.
Trade Idea: Long $61,146 above $64,210 stop below $61,118 targeting $69,205 on double bottom breakout.
- Check out our free forex signals
- Follow the top economic events on FX Leaders economic calendar
- Trade better, discover more Forex Trading Strategies
- Open a FREE Trading Account
- Read our latest reviews on: Avatrade, Exness, HFM and XM
Related Articles


Sidebar rates
Related Posts
