Silver Price Forecast: $66.50 Breakout Blueprint Eyes Major Support Zone Defense Post-FOMC
Silver Price Forecast: XAG/USD establishes a dynamic base at $65.17 as the formal signing of the Switzerland Peace Pact offsets Kevin Warsh’s hawkish Fed debut.
Quick overview
- Silver price (XAG/USD) has established a support level at $65.17 following the signing of the Switzerland Peace Pact, which has reduced geopolitical risk premiums.
- The silver market is experiencing a structural supply deficit for the sixth consecutive year, with a projected shortfall of 46.3 million ounces.
- Despite a hawkish stance from the new Federal Reserve Chairman Kevin Warsh, the fundamentals of the physical silver market remain strong due to ongoing industrial demand.
- Technical analysis indicates that silver is currently oversold, with potential for a bullish bounce if prices stabilize above the support node at $65.00.
Silver Price Forecast: XAG/USD establishes a dynamic base at $65.17 as the formal signing of the Switzerland Peace Pact offsets Kevin Warsh’s hawkish Fed debut.
An aggressive technical reset has occurred in the world-wide silver derivatives complex, which has reduced paper price levels to the important intermediate-term level of value.
On Friday 19 June 2026 the spot price formed a tight defensive holding pattern during the mid-day trading hours around $65.17/oz and large macro desks are aggressively revising their fundamental models to include a long-term regime change in global geopolitics, and long-term demand will soak up paper offers along the long-term structural level of value.
Swiss Treaty Signing De-Escalates Safe-Haven Premiums
The most significant fundamental support factor behind the orderly consolidation of the early afternoon trading session is the formal conclusion and signing of the historic first interim US-Iran deal known as the ‘Islamabad Memorandum of Understanding’ in a heavily-anticipated and closely watched international diplomatic signing event in Switzerland today, which will bring about the resumption of Iranian crude sales, the unlocking of the crucial Strait of Hormuz shipping lane and the lifting of the US naval blockade.
The effective conclusion of the peace initiative should remove the acute geopolitical risk premium from the precious metals market which had been in effect for the past several months.
A sharp drop in the futures market price for front-month contracts of Brent crude oil which are now falling to fresh multi-month lows well below the $80/bbl level should also have helped cool any fears of any renewed bout of energy driven ‘headline’ inflation, with the latter occurring at a particularly difficult time in the economic cycle, with the FOMC having concluded its landmark policy session, and with a new chairman in Kevin Warsh.
Hawkish Warsh Regime Unleashes Macro Headwinds
The new Federal Reserve Chairman Warsh, as expected, having previously held the reputation of being an uncompromising, rules-based monetarist, pointed out the 4.1% persistent core consumer price inflation and 6.5% producer price inflation as requiring a more stringent and highly restrictive monetary policy stance, which will now also see him reiterate expectations of a much more ‘higher-for-longer’ interest rate stance over the near-term, while significantly diminishing the market consensus for any further rate cut to occur in the autumn of this year.
The combination of these factors has sent real US Treasury bond yields and the US Dollar Index firmly onto a front-foot rise with a large structural headwind against the price of precious metals.
Despite the fact that the silver futures market is being entirely at the mercy of short-term positioning by central banks, the fundamentals of the physical market have shown no signs of weakening, as the underlying supply has been supported and backed up from structural long-term demand.
-
The Six Year Supply Deficit: The Silver Institute reported that the physical silver market has now remained in a structural supply deficit for the sixth year in a row, with the size of the deficit projected at a notable 46.3 million ounces. Due to the majority of global silver output, which accounts for around 70% of all silver produced, coming as a joint byproduct of copper, lead and zinc mining, miners can not rapidly increase output to take advantage of higher prices, thereby leaving a significant portion of the silver supply chain insulated against a price decline.
-
A growing appetite and long-term demand from the real industrial market, including high demand for the manufacturing of high-efficiency photovoltaic solar panels, electric vehicles, 5G networking, and other critical high-tech electronics, including large-scale advanced high-capacity power supplies for AI-based data centres. China, as the largest user of silver metal in the world, has increased its purchases and imports significantly as it continues to maintain strong industrial demand, resulting in the global demand for silver in physical form remaining at a high level.
Silver (XAG/USD) Technical Analysis: Oversold Pullback Squeezes Into Key Support
Silver has snapped the 2-hour timeframe, which was recently ignored in favor of the supply-demand imbalance picture, as the paper dump was into a macro, multi-month support node; a perfect swing trader technical sandbox.
Silver $65.17 currently is testing macro support, bouncing hard along the main uptrending support line (black); although prices are still contained within a major, declining channel (descending, black) from the latest price peaks, there is plenty of buying (buying absorption, black) as the prices keep bouncing hard off the local lows, with lower shadow.
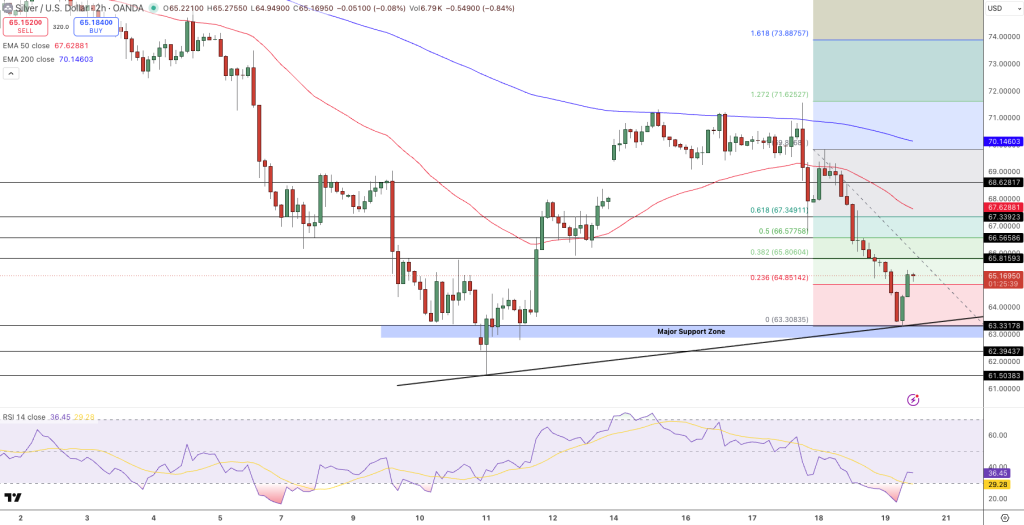
The recent drop is severe in terms of price moving below the major 2H EMA50 @ $67.63, as well as the long term 2H EMA200, at $70.15; as both averages are sloping sharply down and offering heavy overhead supply.
The 14 RSI (2-hour timeframe) has an oversold reading of 36.45. Importantly, there are no new lows being formed alongside the price; a bullish divergence is being formed, indicating sell side exhaustion.
Here’s the trade.
-
Bullish bounce: Buy, on bullish candlestick stabilization of the support node $65.00.
-
Sell side stop: Stop loss at the low @ $63.31.
-
Target: A quick relief up to the 0.500 Fibonacci resistance shelf @ $66.58, then to the major 2H EMA50 @ $67.63, once short cover begins to accelerate.
-
Bearish bounce: Sell, on a breakdown below the local major, horizontal support @ $63.31.
-
Buy side stop: Buy side stop @ $65.50.
-
Target: A quick downside breakdown to major liquidity @ $61.50.
Silver is currently completing a massive structural transition. As an uncompromising, rules-based Fed under Chair Warsh is unlikely to cave and keep the paper market volatile, a rare convergence of an expanding 46.3-million-ounce physical deficit and low-end technical oversold levels should keep XAG/USD coiled, and primed for an intermediate, structural bounce into macro June end.
- Check out our free forex signals
- Follow the top economic events on FX Leaders economic calendar
- Trade better, discover more Forex Trading Strategies
- Open a FREE Trading Account
- Read our latest reviews on: Avatrade, Exness, HFM and XM
Related Articles
Sidebar rates
Related Posts
