Silver Price Forecast: After a 10x Gain in Six Years, What’s Next?
Quick overview
- Silver has experienced a significant correction, surrendering roughly 50% of its recent gains after a remarkable six-year performance.
- The price has broken below key Fibonacci support levels, raising concerns about the sustainability of its long-term uptrend.
- Current support is found at the 50-week EMA near $64.65, with potential downside extending toward the Golden Ratio support zone between $41.3 and $46.7.
- Despite bearish momentum signals, the broader technical structure remains constructive, indicating a potential for recovery if key resistance levels are breached.
Silver has delivered an extraordinary performance over the past six years, rising nearly tenfold from its cycle lows. The precious metal has significantly outperformed expectations, driven by strong investor demand and favorable macroeconomic conditions. However, the trend has shifted since the start of the year. Silver has already surrendered roughly 50% of its recent gains, raising questions about the sustainability of the long-term uptrend. Is this correction merely a healthy retracement within a broader bull market, or does it mark the beginning of a deeper trend reversal?
Silver Breaks Below Key Fibonacci Support
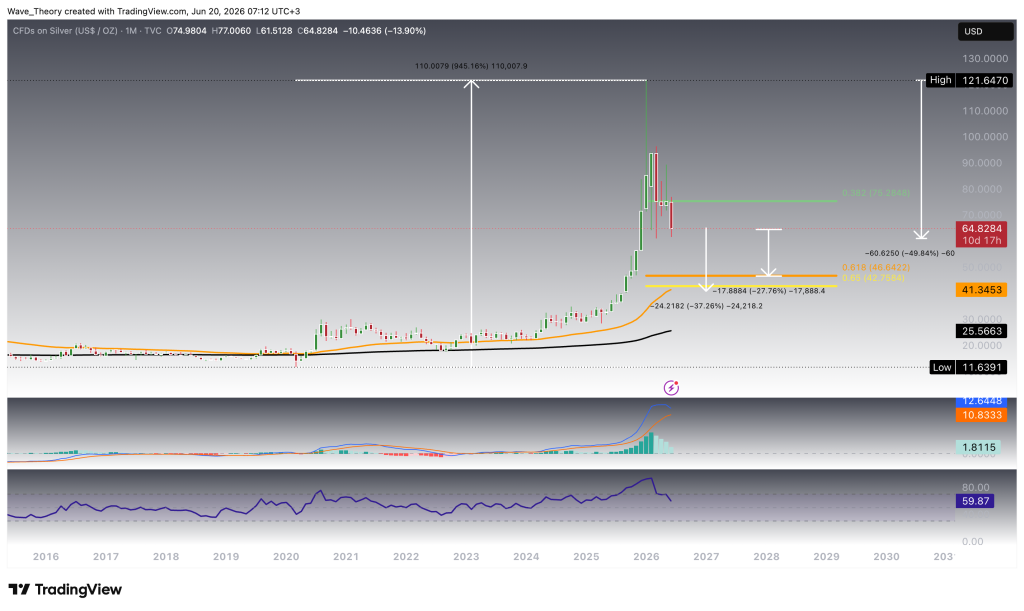
Silver has decisively broken below the 0.382 Fibonacci support at $75 after declining roughly 50% from its all-time high of $121.65.
As a result, the correction could extend toward the Golden Ratio support and the 50-month EMA, located between $41.3 and $46.7. This scenario implies additional downside potential of approximately 28% to 37% from current levels.
Momentum indicators continue to signal weakening bullish momentum. The MACD histogram has ticked lower for four consecutive months, reflecting growing bearish pressure. However, the MACD lines remain in a bullish crossover configuration, suggesting that the broader uptrend has not yet been invalidated.
At the same time, the EMAs remain bullishly crossed on the monthly chart, confirming that the long-term trend is still constructive despite the ongoing correction.
Meanwhile, the RSI remains in neutral territory, providing no clear directional signal at this stage.
Silver Price Finds Immediate Support at the 50-Week EMA
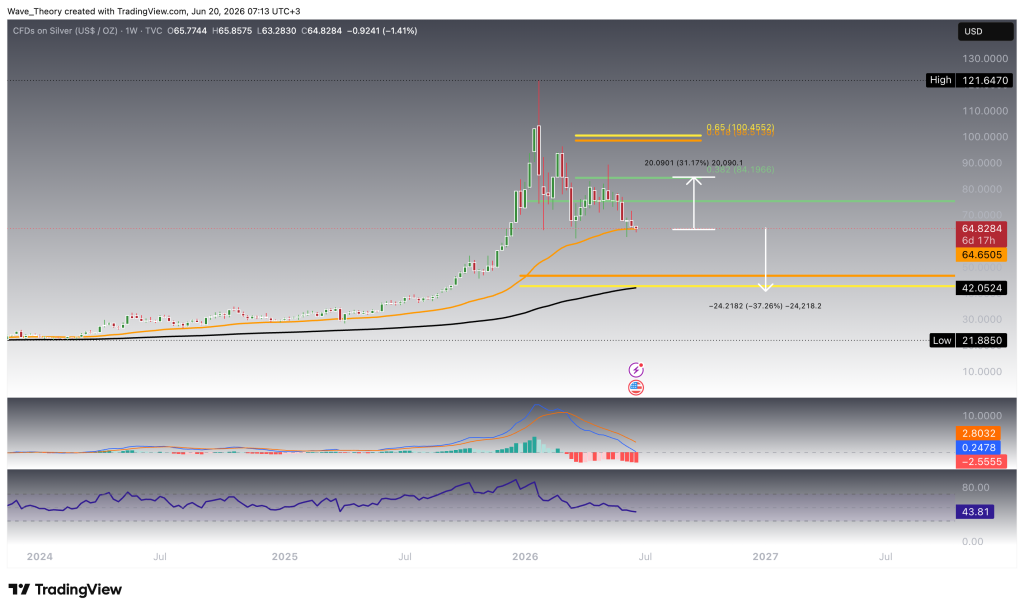
For now, Silver is finding significant support at the 50-week EMA near $64.65. As long as this level holds, the price could stage a bullish rebound toward the next Fibonacci resistance at $84.2, corresponding to the 0.382 Fib level. Such a move would represent upside potential of approximately 31%.
If Silver breaks above this resistance, the next major target lies at the Golden Ratio resistance near $100. A decisive breakout above that level would likely signal the end of the current correction phase. In that case, Silver could revisit its all-time high around $122 and potentially establish new record highs.
However, momentum indicators continue to favor the bears. The MACD lines remain bearishly crossed, while the MACD histogram continues to trend lower, reflecting persistent downside pressure.
Should Silver lose support at the 50-week EMA, the correction could deepen substantially. In that scenario, the price could decline by roughly 37% toward the lower boundary of the Golden Ratio support zone. Additional support awaits at the 200-week EMA near $42.
Despite the bearish momentum signals, the broader technical structure remains constructive. The RSI continues to move in neutral territory, while the EMAs maintain a Golden Crossover on the weekly chart. This confirms that the medium-term trend remains bullish.
Silver Trades Within a Parallel Downward Channel
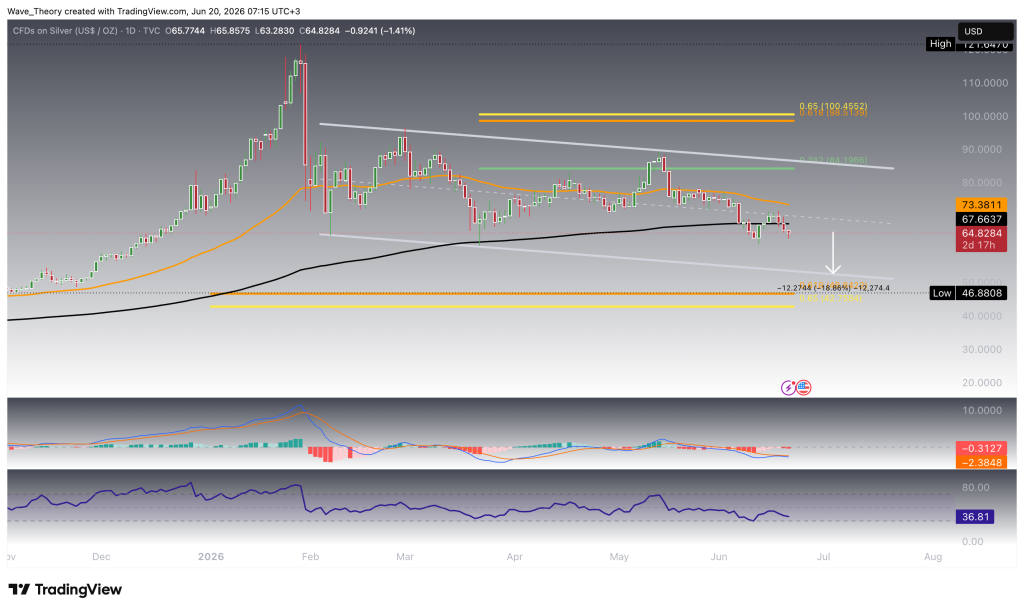
On the daily chart, the indicators continue to provide mixed signals.
The RSI remains in neutral territory, offering no clear directional bias. Meanwhile, the EMAs maintain a Golden Crossover, confirming the short- to medium-term trend remains bullish.
However, momentum indicators paint a more cautious picture. The MACD lines have crossed bearishly, while the MACD histogram continues to tick lower. This reflects increasing downside momentum in the near term.
At the same time, Silver remains confined within a parallel downward channel. As long as this structure remains intact, the correction phase could continue.
A decline toward the channel’s lower support boundary would imply additional downside potential of roughly 19% from current levels.
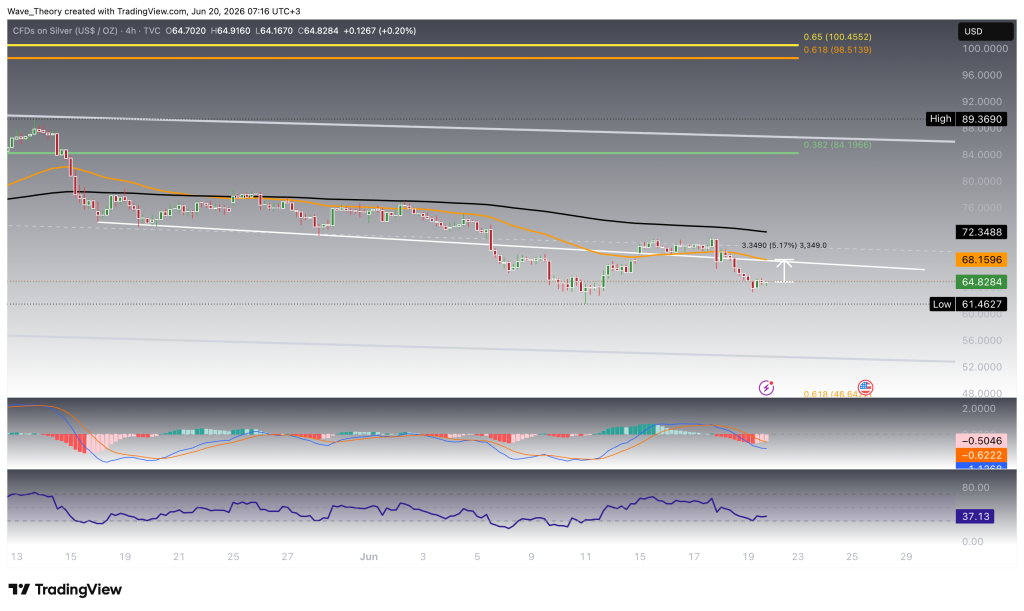
Silver Faces Key Resistance With 5% Short-Term Upside Potential
On the 4-hour chart, the technical indicators remain predominantly bearish.
The MACD lines are bearishly crossed, while the EMAs have formed a Death Cross. This confirms the short-term trend remains bearish.
However, there are early signs that downside momentum is beginning to fade. The RSI remains in neutral territory, while the MACD histogram has recently started ticking higher. This suggests bearish momentum is weakening.
If Silver attempts a recovery, it will face significant resistance at the 50-period EMA on the 4-hour chart near $68.15. A move toward this level would imply upside potential of roughly 5% from current prices.
Until the Silver price breaks above this resistance, the broader short-term outlook remains cautious.
Silver Price Summary: Key Levels to Watch
Silver remains in a broader bullish trend despite correcting roughly 50% from its all-time high at $121.65. The price has broken below the 0.382 Fibonacci support at $75, signaling that the correction could extend further.
The most important support currently sits at the 50-week EMA near $64.65. If this level fails, Silver could decline toward the Golden Ratio support zone between $41.3 and $46.7, where the 200-week EMA at $42 provides additional support.
To the upside, Silver faces immediate resistance at the 50-period EMA on the 4-hour chart near $68.15. A breakout above this level could pave the way for a move toward the 0.382 Fib resistance at $84.2. Beyond that, the key level to watch is the Golden Ratio resistance near $100. Only a decisive break above $100 would likely confirm the end of the correction phase and open the door for a retest of the all-time high around $122.
While momentum indicators remain mixed, the monthly and weekly EMA structures continue to confirm a bullish medium- to long-term trend.
- Check out our free forex signals
- Follow the top economic events on FX Leaders economic calendar
- Trade better, discover more Forex Trading Strategies
- Open a FREE Trading Account
- Read our latest reviews on: Avatrade, Exness, HFM and XM
Related Articles

Sidebar rates
Related Posts
