Prices Forecast: Technical Analysis
For today, we predict PayPal Holdings, Inc. will close at approximately $56.75, with a trading range between $55.78 and $57.26. Looking ahead to the week, we anticipate a closing price around $57.00, with a range of $56.00 to $58.00. The technical indicators suggest a strong bullish momentum, as evidenced by the RSI at 80.59, indicating overbought conditions. The ATR of 1.946 suggests moderate volatility, which could lead to price fluctuations within the predicted range. The pivot point at $56.47 indicates that the asset is currently trading above this level, reinforcing a bullish outlook. Resistance levels at $57.26 and $57.95 may act as barriers to upward movement, while support at $55.78 could provide a safety net for buyers. Overall, the combination of high RSI and strong price action suggests that traders should look for buying opportunities, especially if the price holds above the pivot point.
Fundamental Overview and Analysis
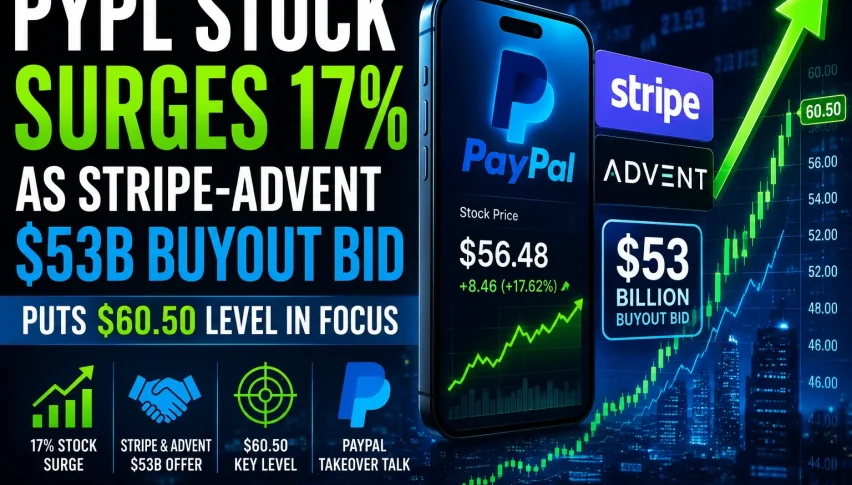
PayPal Holdings, Inc. has shown a robust performance recently, with prices trending upward due to increased adoption of digital payments and e-commerce growth. Factors such as consumer demand for online transactions and strategic partnerships have positively influenced the asset’s value. Investor sentiment remains optimistic, driven by strong quarterly earnings reports and positive market forecasts. However, challenges such as regulatory scrutiny and competition from other fintech companies could pose risks. The current valuation appears to be fairly priced, considering the growth potential in the digital payment sector. Opportunities for expansion into new markets and services could further enhance PayPal’s growth trajectory. Nevertheless, market volatility and potential economic downturns could impact future performance, making it essential for investors to stay informed about market conditions.
Outlook for PayPal Holdings, Inc.
The future outlook for PayPal Holdings, Inc. remains positive, with expectations of continued growth in the digital payment space. Current market trends indicate a strong demand for online payment solutions, which could drive prices higher in the short term. Over the next 1 to 6 months, we anticipate a price movement towards $60, supported by ongoing consumer adoption and technological advancements. In the long term, the asset could see prices reaching $70 to $80, assuming continued market expansion and successful navigation of regulatory challenges. External factors such as geopolitical stability and economic recovery will play a crucial role in shaping the asset’s price trajectory. Investors should remain vigilant about market dynamics and be prepared for potential fluctuations due to economic conditions.
Technical Analysis
Current Price Overview: The current price of PayPal Holdings, Inc. is $56.56, which is slightly above the previous close of $56.56. Over the last 24 hours, the price has shown slight upward movement with moderate volatility. Support and Resistance Levels: Key support levels are at $55.78, $54.99, and $54.30, while resistance levels are at $57.26, $57.95, and $58.74. The pivot point is $56.47, indicating that the asset is trading above this level, which is bullish. Technical Indicators Analysis: The RSI is at 80.59, suggesting a strong bullish trend. The ATR of 1.946 indicates moderate volatility, while the ADX at 25.47 shows a strengthening trend. The 50-day SMA is at $45.68, and the 200-day EMA is at $46.00, indicating a bullish crossover. Market Sentiment & Outlook: Sentiment is currently bullish, supported by price action above the pivot point, a high RSI, and a strengthening ADX.
Forecasting Returns: $1,000 Across Market Conditions
The table below outlines potential investment scenarios for PayPal Holdings, Inc. based on varying market conditions. Investors should consider these scenarios when deciding whether to invest $1,000 in the asset.
| Scenario | Price Change | Value After 1 Month |
|---|---|---|
| Bullish Breakout | +10% to ~$62.26 | ~$1,100 |
| Sideways Range | 0% to ~$56.56 | ~$1,000 |
| Bearish Dip | -5% to ~$53.73 | ~$950 |
FAQs
What are the predicted price forecasts for the asset?
The predicted daily closing price for PayPal Holdings, Inc. is approximately $56.75, with a weekly forecast of around $57.00. The price is expected to range between $55.78 and $57.26 today.
What are the key support and resistance levels for the asset?
Key support levels for PayPal are at $55.78, $54.99, and $54.30. Resistance levels are at $57.26, $57.95, and $58.74, with a pivot point at $56.47.
What are the main factors influencing the asset’s price?
Factors influencing PayPal’s price include increased adoption of digital payments, consumer demand, and strategic partnerships. Regulatory scrutiny and competition from other fintech companies also play a significant role.
What is the outlook for the asset in the next 1 to 6 months?
The outlook for PayPal in the next 1 to 6 months is positive, with expectations of price movements towards $60. Continued consumer adoption and technological advancements are key drivers.
What are the risks and challenges facing the asset?
Risks facing PayPal include regulatory challenges, market volatility, and competition from other fintech companies. These factors could impact future performance and investor sentiment.
Disclaimer
In conclusion, while the analysis provides a structured outlook on the asset’s potential price movements, it is essential to remember that financial markets are inherently unpredictable. Conducting thorough research and staying informed about market trends and economic indicators is crucial for making informed investment decisions.