Trading Course
6 Killer Combinations for Trading Strategies
- Killer Combinations for Trading Strategies
- Combining Indicators
- Determine trends
- Divergence Trading- Predict the future
- Trading Plan – Retracement and Reversal Strategy
- Opening and Closing Positions
- Triangles for a Breakout
- Currency Correlation (Fundamental Strategy)
- Trading Recommendations for Currency Correlation
- Carry Trade
- Practice
Killer Combinations for Trading Strategies
In Chapter 9 we will show you which trading strategies you can combine to get a better understanding of what the market will do.
- Elliott Wave – Prediction pattern
- Divergence Trading: Predict the future
- Trading plan: Retracement/Reversal Strategy
- Opening and closing position – 2 simple trading strategies
- Currency Correlation: Fundamental Strategy – play your currencies like a game of chess
- Carry Trade: Great alternative strategy
Combining Indicators
In the last lesson, we introduced key technical indicators and explained how they work individually. Now, we’ll focus on combining them to get better trading signals. Using 2-3 indicators together is helpful, but using more can get confusing., the best way to build a forex strategy is to combine the indicators.
Now let’s see six fantastic (in our opinion) combinations, to wrap up this subject:
Moving Average + Stochastic
Moving Average (MA) + Relative Strength Index (RSI) + Volume
- Why it’s effective: Moving Averages (particularly EMA) are great for identifying trends, RSI is useful for spotting overbought or oversold conditions, and Volume confirms the strength of price movements. This combination is effective in trending markets to validate breakouts or potential reversals.
- Focus: Use it to confirm trend direction and momentum with volume validation.

Bollinger Bands + Stochastic
Bollinger Bands + RSI + Moving Average Convergence Divergence (MACD)
- Why it’s effective: Bollinger Bands help gauge volatility, while RSI and MACD can signal trend strength and direction. This combination helps identify entry points when the price hits the outer Bollinger Bands, RSI shows oversold/overbought, and MACD confirms momentum.
- Focus: Ideal for spotting potential breakouts and reversals in volatile markets.

Fibonacci + MACD
Fibonacci Retracement + MACD + Parabolic SAR
- Why it’s effective: Fibonacci levels help identify key support and resistance zones. MACD confirms the trend’s momentum, and Parabolic SAR helps detect potential trend reversals. This combination is powerful in both trending and retracement scenarios.
- Focus: Excellent for spotting retracements and entries during trending conditions or reversals after retracement levels are hit.

MACD + RSI
VWAP (Volume Weighted Average Price) + RSI + Stochastic Oscillator
- Why it’s effective: VWAP is widely used in 2024 because it provides a volume-weighted view of average price, making it a good indicator of fair value. Combining it with RSI and Stochastic Oscillator helps identify overbought/oversold conditions and spot reversal points at important VWAP levels.
- Focus: Best for intraday traders who need to find good entry/exit points based on fair value and momentum.

Parabolic SAR + EMA
ATR (Average True Range) + Moving Average (EMA) + MACD
- Why it’s effective: ATR measures volatility, while EMA helps track the trend, and MACD confirms momentum shifts. This combination is particularly useful for placing stop-loss orders and ensuring you’re trading during times of significant market movement.
- Focus: Use this for volatility-based strategies, helping set stop-loss and take-profit targets that adjust to changing market conditions.

Parabolic SAR + Stochastic
Ichimoku Cloud + RSI + Stochastic
- Why it’s effective: The Ichimoku Cloud is a comprehensive tool that provides insight into trend direction, momentum, and support/resistance. Adding RSI and Stochastic helps fine-tune entries and exits by confirming whether the market is overbought/oversold.
- Focus: Great for swing traders and those looking to trade both trends and reversals with strong signals.

Determine trends
When using technical indicators in trading, you’re essentially trying to predict future price movements based on past data. Indicators like the EMA (Exponential Moving Average) and MACD (Moving Average Convergence Divergence) are commonly used for this. They help you decide when to enter or exit a trade, which direction the market might move, and when trends could change.
However, just like in sports, indicators don’t guarantee results. Think of it like preparing for a basketball game. Below is an example:
NBA Game vs. Kobe Bryant
Imagine you’re an NBA player, and your team is about to face Kobe Bryant and the Lakers. Your coach analyzes Kobe’s past performance:
- He averages 7 free throws per game.
- He scores 90% of his free throws.
- He likes driving to the basket from the right side.
With this data, your coach prepares a game plan because there’s a high chance Kobe will play similarly in the next game. But this doesn’t guarantee Kobe will perform the same way tomorrow. Maybe he has a bad day, or maybe he tries a different approach.
In trading, indicators like the EMA and MACD provide signals based on past market data. For example:
- EMA helps track trends by smoothing price data.
- MACD shows changes in momentum, giving you buy or sell signals.
But just like in basketball, there are no guarantees. Sometimes the indicators give you the wrong signal. For example:
- MACD might give a “buy” signal, but then the price drops instead.
- EMA might not signal a trend change, even though the market is shifting.
Be Careful!
- Indicators aren’t perfect: Just like Kobe might not always follow his usual game style, the market may not behave exactly as indicators predict.
- Use them wisely: It’s important to use these tools, but be cautious, and don’t rely on them 100%. Always be prepared for the unexpected in trading.
Take the next chart for example which contains two indicators – EMA (on the chart) and MACD (Beneath it):

You can see on the chart that the signals were wrong! On the left marked spot on the chart, MACD (Buy) gets it wrong- you can notice the price decline right after the BUY signal; On the right marked spot EMA gets it wrong- It doesn’t provide any signal at all of a coming uptrend, while MACD does provide the correct BUY signal.
Another problem is that there are times when different indicators provide different signals.
Another example with 3 indicators on the chart – Stochastic, RSI (both beneath the chart), and Parabolic SAR (on the chart):

You can see that all the indicators point us towards the same actions. Bravo! It is a pleasure doing business with you… Onward, let’s cooperate with the indicators and follow the alerts. There are good chances for them to happen.

Here, on the other hand, the case is different the Parabolic SAR + Stochastic + RSI show that indicators often do not correlate with each other. It can cause confusion among traders. In case each indicator gives you different alerts, it is better not to make any move at all! Wait for other opportunities. If you want to open a position anyway – go with the majority.
Elliott Wave – Prediction Pattern
One of the key fundamentals for technical analysis, named after Ralph Nelson Elliott, an economist.
Imagine a beach where the waves keep hitting the shore. You start noticing a pattern – big wave, smaller wave, big wave. Elliott Wave theory tells us that these market waves are predictable because human psychology drives them. Wave 1 might represent optimism (prices rise), Wave 2 shows a pullback as traders take profits (prices dip), but then Wave 3 represents a stronger bullish move, as more people buy into the trend. These waves keep repeating.
However, just like waves at the beach can be disrupted by sudden changes in weather, market waves can be affected by unexpected news or events. That’s why it’s important not to depend solely on Elliott Waves but to confirm them with other indicators like Fibonacci retracements or MACD.
Elliott Wave Prediction Pattern is still relevant and remains a powerful tool for 2024, for analyzing market trends. However, a few additional points can enhance understanding and make it more applicable to modern-day trading:
See below how the Moden way of trading there more factors are to consider:
Integration with Modern Tools
AI & Machine Learning: Many traders now use AI tools to help automate the identification of Elliott Wave patterns. AI can reduce the human error factor and assist in finding wave patterns that are harder to spot manually.
Combination with Other Indicators
As you already noted, traders should avoid relying too heavily on any single indicator. In combining Elliott Waves with other indicators like Fibonacci retracement levels, Moving Averages (EMA), and MACD can offer better confirmation. For example, Wave 3 often aligns with Fibonacci retracement levels, but adding MACD can confirm trend momentum and ensure that signals are stronger.
Volatility and Timeframes
Elliott Waves can be harder to spot in high-volatility markets. In 2024, especially with geopolitical events, inflation concerns, and rapid market shifts, shorter timeframes often create noise, making it difficult to identify clear wave patterns. Remind students to use longer timeframes when possible to reduce noise and increase accuracy.
Common Pitfalls
Market Manipulation and External Factors: Modern markets, influenced by social media, news, or large financial institutions, can disrupt patterns. Sudden announcements or algorithmic trading may cause patterns to break down, leading to losses if traders are relying too heavily on Elliott Waves alone.
Elliott Waves and Crypto Markets:
Elliott Waves are now frequently applied in highly speculative markets like cryptocurrencies. In 2024, cryptocurrencies show rapid price movements, and identifying Elliott Wave patterns can be beneficial, but the inherent volatility of these markets makes wave patterns more unpredictable.
Let’s see what an Elliott Wave looks like on the following charts:


This image shows the Elliott Wave pattern, a key concept in technical analysis for predicting trends in financial markets. The waves are divided into two main parts: the Impulse Waves (green) and the Corrective Waves (red).
Impulse Waves (1 to 5):
Waves 1 to 5 represent the primary trend direction (either up or down). In this chart:
- Wave 1: The initial rise, where some traders start buying.
- Wave 2: A slight pullback as early traders take profits.
- Wave 3: This is often the strongest and longest wave. More traders join the trend, driving the price higher.
- Wave 4: Another pullback, but not as strong as Wave 2, since the overall trend is still upward.
- Wave 5: The final push upwards, often driven by latecomers who are catching onto the trend.
Corrective Waves (A, B, C):
After the impulse waves, the market needs to correct itself, which happens in three stages:
- Wave A: The first drop after the uptrend. Traders start selling to take profits.
- Wave B: A small bounce back, but it doesn’t reach the peak of Wave 5.
- Wave C: A final downward move, typically larger than Wave A, signaling the end of the correction.
How It Works in Trading:
- When the market is in Wave 1 to 5, traders generally look to buy as the trend is rising.
- Once the A, B, and C pattern begins, traders may either take profits or look for a buying opportunity after Wave C completes, expecting the trend to reverse or stabilize.
This pattern repeats itself over time in markets, making it a useful tool to identify potential entry and exit points based on where you are in the wave cycle. Pay attention to all 8 stages of the Elliot Wave in the following chart:

Will the pattern repeat itself? Bingo!

Identifying an Elliot Wave in time can produce great profits for us traders! Here is a nice example of identifying the opening point of wave #3 with Fibonacci’s help (Ratio 0.618):

Let’s check what happens next:

In most cases, the wave’s height is approximately the same as the three main Fibonacci ratios (.50, .382, and .618).
Problem – Many traders tend to rely on this pattern too much, but it is wrong to put all your eggs in one basket and completely rely on it! In addition, in many cases, Elliott waves are hard to identify. Traders make recognition mistakes and wrong interpretations of the charts.

Divergence Trading- Predict the future
Wouldn’t it be great if you could foresee future events? For example, the winning numbers in the next lottery? Let’s not get carried away… We are not going to say that we know how to do it (we are obviously not Harry Potter), but Divergence Trading surely helps us a lot to predict the next price movements. Divergence happens when the directions on the price chart and the indicating graph split. When divergence occurs it helps us determine whether we are witnessing a good exit/entry point. Divergence trading allows us to wait with our executions until right near the ultimate point on the trend, and by doing so, enlarge profits and reduce risks at the same time!
How to do it in practice? Simply, by comparing price movement on the chart to what the indicator shows.
Regular Divergence 2 types of Divergence – Regular divergence is all about finding trend reversals. This means the current trend might be coming to an end, and a new trend could start soon.
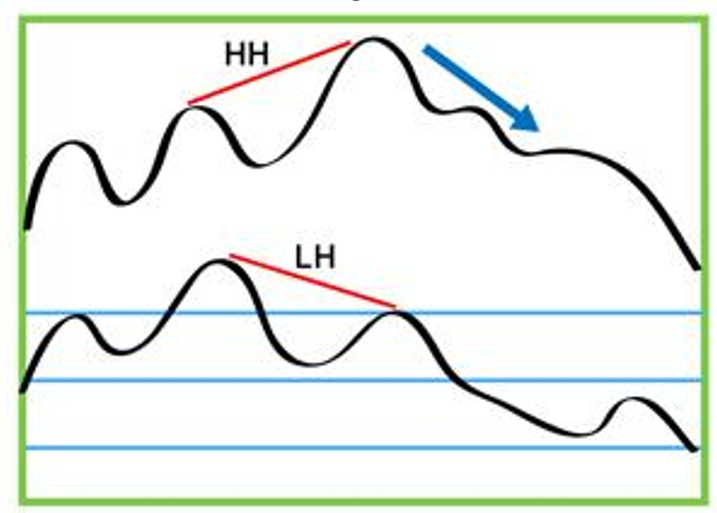
Bearish Regular Divergence (signals a downtrend coming):
When the price moves from a high to a higher high, and the indicator moves from a high to a lower high, you should prepare yourselves for a bearish divergence:
Example: Imagine the price of EUR/USD is rising higher and higher, but the RSI is showing lower highs. This could be a signal that the uptrend is losing strength, and a downtrend is coming. You might want to sell or exit a long position.
Bullish Regular Divergence (signals an uptrend coming)
When the price moves from a low to a lower low, and the indicator moves from a low to a higher low, you should prepare yourselves for a bullish divergence:
Example: f EUR/USD keeps dropping to new lows, but the MACD is showing higher lows, this could be a clue that the downtrend is ending. You might consider a buy or enter a long position.
Remember: An indicator that is acting contrary to the price is alerting us to price weakening and possible change in momentum!
Example: Let’s see how Regular Divergence looks on a real chart, using Stochastic.

You will notice the perfect “HH/LH Regular Divergence”. This type of divergence signals a reversal to a downtrend. Is that what is going to happen here?

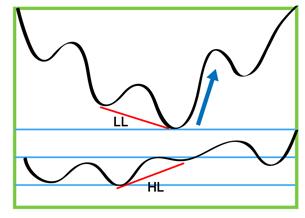
Hidden Divergence – a sign of an expected continuation of a certain trend. The next graph signals a bullish hidden divergence:

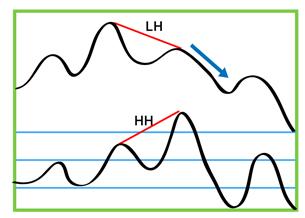
Pay attention to the price, which moves from Low to Higher Low, and to the indicator which moves from Low to Lower Low. In this case, the graph signals a continuing uptrend. The next drawing shows a bearish hidden divergence and signals a continuation of price decline:
Example on the EUR/USD, 1-hour chart. Let’s see how hidden divergence looks on a real chart, using Stochastic:

You can notice the perfect “HL/LL Hidden Divergence”. This type of divergence signals a continuation of the uptrend. Is that what is going to happen here?

Tip: Divergence is much more effective for long-term trades.
Remember: Recommended indicators for using the Divergence method are mainly MACD, RSI, and Stochastic. Here we sometimes use divergence for our long-term forex signals.
Divergence – 10 Factors to Remember
- To draw lines- The gap between the two highs or the two lows of the price needs to be clear, without interruptions
- Use appropriate indicators- Different indicators can provide varying insights into market conditions.
- Compare the attached line on the price chart to the attached line on the indicator’s graph
- If noticing a divergence too late, no worries! Be patient and wait for the next one to appear
- Use Multiple Time Frames- Analyzing divergence across different time frames can provide a clearer picture of the market’s direction.
- Look for Confirmation– Before acting on a divergence signal, seek confirmation from other indicators or price action.
- Volume Analysis– Pay attention to volume when divergence occurs.
- Set Stop-Loss Orders- Always use stop-loss orders to manage risk. In the case that the divergence signal is incorrect, a stop-loss can help limit potential losses.
- Recognize Divergence Types- Both regular and hidden divergences exist, and each serves different purposes. Regular divergence indicates potential reversals, while hidden divergence indicates trend continuation. Understanding these differences can aid in decision-making.
- Avoid Overtrading– Divergence signals can sometimes take time to play out.

Trading Plan – Retracement and Reversal Strategy
Retracement occurs when the price of a currency pair temporarily moves against the prevailing trend. Think of it as a pause or a small pullback in the price movement. For example, if the price of a currency pair has been going up, a retracement would be when the price dips down briefly before continuing upward. Usually takes place when a pair reaches the three Fibonacci ratios – 61.8%, 50%, or 38.2%, and stops, before returning to its overall direction.
Reversal A reversal happens when the price changes direction from an uptrend to a downtrend (or vice versa). This means that instead of just pulling back, the price has completely changed its trend. If the price crosses all these levels and passes 61.8%, there might be a good chance for a reversal.
Let’s watch an example of the pair EUR/CHF:

Another good tool is the Trendline. If being cut by the price, we are possibly about to witness a reversal:
A reversal happens when the price changes direction from an uptrend to a downtrend (or vice versa). This means that instead of just pulling back, the price has completely changed its trend.

Experienced traders have valuable insights into currency behavior. They often observe that major currency pairs tend to reach their highest points during the early hours of the New York session when the London session is still ongoing. This knowledge allows them to anticipate market movements based on the overlap of these trading sessions.
Traders use various indicators to identify specific areas on the chart where prices may slow down, reverse, or return to their daily average. This helps them make informed predictions about future price movements. Additionally, traders can calculate the Average Daily Range (ADR) of a currency pair over a chosen period. For example, if the ADR indicates that a pair has moved an average of 120 pips daily over the past 20 days, traders can expect a similar range unless significant market events disrupt this trend.
In summary, understanding the dynamics of trading sessions and utilizing tools like ADR empowers traders to make educated predictions about price behavior, increasing their chances of successful trades.
Trading example – 2 Time frames
In this example, we’ll look at a trading chart during the London session for the EUR/USD currency pair. We are using a 10-minute chart, meaning each candlestick shows price movement for 10 minutes. The chart covers 5 hours, from 8 AM to 1 PM GMT (London time).
At this time, the New York session has also started, overlapping with the London session. This overlap is important because it can lead to increased trading activity.
To understand how prices move throughout the day, we want to find the daily average price range. This average helps us predict how the price might behave for the rest of the day across all trading sessions.
Looking at the chart, we see that when the London session opened, the price of EUR/USD was 1.2882.
Next, assume we are talking here about the pair EUR/USD:

During the London session, you can see the price of EUR/USD moving down, reaching a low of 1.279. Just after the New York session starts, the price goes up slightly to 1.2812.
We used the ADR (Average Daily Range) tool, which tells us the average movement (in pips) for this pair over the last 20 days. The ADR shows that the EUR/USD typically moves 120 pips per day.
So, what can we do with this information? We focus on the highest and lowest points so far: the max is 1.2882, and the min is 1.2789. Using these numbers, we can estimate possible support and resistance levels for later in the day during the New York session.
- Possible support: 1.2762 (calculated as 1.2882 minus 120 pips)
- Possible resistance: 1.2909 (calculated as 1.2789 plus 120 pips)
These levels help us predict where the price might stop or reverse during the rest of the day.
Next Example: Multiple Time Frames
So far so good, right? Well, guys, now comes the real tricky part. This is the expertise step. If you wish to rely on trade-like pros, it would be necessary to recheck and verify your strategy:
Now, let’s take a closer look at our pair using Multiple Time Frames. We will switch to a 2-hour chart, where each candlestick shows 2 hours of price movement. This will help us check if the support and resistance levels we calculated earlier match what we see in this longer time frame.

Remember which are the most efficient indicators for Retracement/ Reversal Strategy? Don’t worry! We will remind you- Fibonacci and Pivot Points.
Well, our suspicions were verified! You can see on the chart that 1.2909 is indeed a strong resistance level! Pay attention to what happens on 1.2762- It sits exactly on top of the 0.5 Fibonacci ratio! Notice that at first it is used as support, and when it is breached it turns into resistance. We do expect it to turn into a support level again later on during the current N.Y. session!
Right now we have an outstanding trading plan for the rest of the day! We figured out where the support and resistance are going to be, and we figured out the daily price range. We are set to go.
Now, we know that this particular paragraph was a bit harder. Take your time to let it sink.
Another useful tool for this strategy is Pivot Points. These help identify key levels where the price might change direction. If the price breaks through the support or resistance levels, it could signal a reversal. However, if the price doesn’t break all 3 pivot points, it’s more likely that we’re seeing a retracement and the price will return to its main trend.

Opening and Closing Positions
You are about to learn very simple, intuitive, and basic trading strategies, that summarise parts of the material so far very well.
Swing Trade– Short-term trading strategy. Usually lasts from a couple of days to a week. The goal of this strategy is to ride existing market trends and to take as much advantage of them as you can, to make relatively quick profits while reacting fast to changes in market behavior. The idea is to ride the wave. Every major trend is built of groups of waves. The method is to decide when to buy and when to sell by observing the waves.
Fibonacci to our rescue again:

Once again, only this time with Fibonacci – let’s take a closer look at the inner trends in the second part of the general uptrend – or as they are called – ‘trend within a trend’. That name comes from the smaller timeframe charts, if you look at the 4-hour chart you will see the bigger uptrend.
But if you change to smaller timeframes during the retrace, such as the 15-minute chart, all you can see is a downtrend. We will check if a healthy pullback occurs (when the pullback meets the Fibonacci criteria inside the overall trend):

Two waves up, approximately the same size, two corrections, twice on ratio 0.50 or the 50% Fibonacci retracement level – Well, we have a pattern. Good chances for the swinging uptrend to continue!
Two important points to take into consideration:
- Having a trading plan is crucial in this business. The plan might not be the same for every trade, i.e. you might alter it from one trade to another depending on the analysis, but having a trading plan is a must. Don’t be too aggressive by trying to win the whole trend. It is impossible to predict precisely the peaks and lows. Don’t force yourself if you are late on a specific trend. Wait for the next one to arrive! As the saying in forex goes, don’t follow the price, let it come to you.
- Set Stop Losses. It is extremely important! We strongly advise you to set them on every one of your positions! Get used to working with ‘stop loss’ and ‘take profit’ orders.
Breakouts – This strategy is efficient mainly for ranging trend conditions. In this method, we look at the support and resistance levels, and once we identify a breakout, that would be our entry point, in the expectation that the trend will follow that direction:

Don’t forget to set a Stop Loss!
A Stop Loss is crucial to protect you from losing too much if the market moves against you. In our example, we placed the Stop Loss just above the breakout point, in case the market does a “fake-out” (when it looks like a trend but quickly reverses). This helps minimize losses if we were wrong about the trade.
Once the price has moved in your favor and is further from your entry point, you can move your Stop Loss a bit lower, just under your entry point.
Many trading platforms like MT4 and MT5 offer a Trailing Stop Loss. This allows you to set a stop loss (for example, 50 pips), and as your trade moves into profit, the stop loss automatically adjusts to secure more of your profit. So, even if the trade reverses, you still lock in some gains.
To ensure profits move your Stop Loss in the direction of the trend!

Triangles for a Breakout
Triangles are fantastic tools (You met them a few lessons ago) for Breakout strategy:


When the triangle is symmetrical the situation is a little different. Breakout can occur on both sides, therefore we activate an OCO action (One Cancel the Other). We set 2 entries – one above the vertex and the other below it. You must remember to cancel the one that turns out to be contrary to the new direction of the trend:

Currency Correlation (Fundamental Strategy)
Currency pairs have intricate relationships with one another, ranging from close and strong correlations to more distant and weaker connections. Correlation quantifies these relationships, indicating how one currency pair may react to the movements of another. These correlations can be positive, negative, or even neutral.
Understanding Correlation:
- Perfect Positive Correlation (1): The two pairs move in the same direction 100% of the time.
- Perfect Negative Correlation (-1): The pairs move in opposite directions 100% of the time.
- No Correlation (0): There is no observable connection between the two pairs.
Importance of Correlation in Trading:
- Hedging: Correlated currencies can be used for hedging strategies, minimizing risks when trading multiple pairs.
- Simultaneous Positions: Experienced traders often open multiple positions at once. Understanding correlations helps them manage their risk effectively.
Current Correlation Table (as of October 2024)
| 🔎 Pair | 1 Week | 1 Month | 3 Months | 6 Months | 1 Year |
| 💴 EUR/USD | 0.96 | 0.42 | 0.79 | 0.55 | -0.01 |
| 💶 GBP/USD | -0.74 | -0.82 | -0.65 | -0.81 | -0.89 |
| 💵 USD/CHF | -0.15 | -0.78 | -0.73 | -0.51 | -0.55 |
| 💷 USD/CAD | -0.86 | -0.47 | 0.39 | -0.13 | -0.44 |
| 💴 USD/JPY | 0.99 | 0.56 | -0.35 | 0.11 | 0.24 |
| 💶 NZD/USD | 0.98 | 0.27 | /0.16 | 0.33 | 0.39 |
| 💵 AUD/USD | 0.73 | 0.00 | -0.64 | /0.21 | 0.38 |
Analysis from the Table:
- The correlation between EUR/USD and USD/CHF is significantly negative across various timeframes, which means they typically move in opposite directions. For instance, if you plan to buy EUR/USD, consider selling USD/CHF to balance your positions.
- The EUR/USD and GBP/USD pairs have a very high positive correlation (0.96 for 1 week), indicating they often move together. Therefore, trading both in the same direction might increase your risk without diversifying your portfolio.
Trading Tips:
- Avoid trading pairs that show perfect or near-perfect correlations. For example, trading EUR/USD and GBP/USD simultaneously may not provide the risk reduction you seek.
- Correlations fluctuate over different timeframes. Notably, the correlation between EUR/USD and GBP/USD decreases from 0.96 in one week to 0.42 over one month, indicating a changing relationship. Stay aware of these shifts, as they may result from changes in interest rates, economic events, or other fundamental factors.
- Keep in mind that news affecting one pair may also influence others, leading to shifts in correlations.
Understanding currency correlations can enhance your trading strategy, helping you to manage risks more effectively. Aim to diversify your trades across pairs with moderate correlations (between 0.5 and 0.7, or -0.5 to -0.7) to optimize your trading performance.


Trading Recommendations for Currency Correlation
Avoid Trading Highly Correlated Pairs: It is not advisable to trade pairs with perfect or near-perfect positive or negative correlations. Engaging in buying one pair while selling another does not create a balanced plan; it merely results in paying double commissions for positions that offset each other. This strategy lacks efficacy and can increase your overall trading costs without offering risk reduction.
Monitor Correlation Changes: Correlations can vary significantly across different timeframes. For example, as per the latest data, the weekly correlation between EUR/USD and GBP/USD stands at 0.96, indicating a strong positive correlation. However, this drops to 0.42 over a monthly period. Understanding these fluctuations is crucial as they may be influenced by various fundamental factors such as changes in interest rates and political developments.
Impact of News on Correlations: Remember that news related to one currency pair can affect other pairs as well. Therefore, staying informed about economic announcements and geopolitical events is essential for understanding potential shifts in correlation.
Risk Management through Correlation: Utilizing correlation can help spread and reduce risks in your trading strategy. It’s advisable to divide your trades among pairs that exhibit strong, but not excessively strong, correlations. Aim for ranges between 0.5 and 0.7 (positive) or -0.5 to -0.7 (negative) to optimize your risk management.
Testing Forex Trade Signals: Correlation also allows you to test trading signals across similar pairs. If you suspect a particular pair is about to break out on the chart, analyze the corresponding chart of a related pair to gauge its behavior.
Typical Same Direction Moving Currency Pairs:
Typical Inversely Moving Currency Pairs:
- EUR/USD and USD/CHF
- GBP/USD and USD/JPY
- USD/CAD and AUD/USD
- USD/JPY and AUD/USD
- GBP/USD and USD/CHF

Carry Trade
Carry trade works on selling, or “lending” (go short) a currency with a low interest rate; and buying (“borrowing”) a currency with a high interest rate. Right now the CHF, JPY, and EUR have the lowest interest rates, while the TRY, BRL, and ZAR have the highest rates. We showed this in the table in the first few pages of this course, so consider these currencies if you want to use this strategy.
Carry trade is an effective system for profits when the market is “resting”. Potential profits derive from the differential (difference) between both currencies’ interest rates, and the expectations for future changes in those two interest rates. That is to say, part of a trader’s considerations when choosing a pair to “carry trade” will be his expectations that in the short run, changes in the interest rate of one or both of the currencies of the pair will occur. If the differential grows, the trader earns, and vice versa.
Example:
Imagine you’re a baker. You want to make a profit by buying flour cheaply and selling it for more.
- Buying Low: You find a supplier who is selling flour at a very low price. This is like borrowing money from a country with a low interest rate.
- Selling High: You sell the flour to a bakery that needs it urgently and is willing to pay a higher price. This is like investing the borrowed money in a country with a high interest rate.
- Profit: The difference between the low buying price and the high selling price is your profit. This is similar to the interest rate differential you earn in a carry trade.
Nice, wouldn’t you think? Well, that is how Carry Trade works. Carry Trade catches are very popular among experienced traders. There are more than a few brokers who offer this service automatically on their platform.
Traders must be cautious of unexpected interest changes in developed economies, third-world countries, and unstable periods. This system is usually efficient for “heavy” players and big money speculators, who invest a great deal of capital, and wish to produce nice earnings on interest rates.
Forex Trading Strategy Example:
Let’s assume that you have $10,000 for investment. Instead of going to your bank and maybe getting 2% annual interest ($200 per annum), you could invest your money in Forex and go Carry Trading on a chosen pair. Based on what you have learned about leverage, you can choose to leverage your 10,000 reasonably- leverage it 5 times.
Your $10,000 is now worth $50,000. OK, pay attention now: you have opened a position worth $50,000 with an actual $10,000. Assume that during the next year, the differential ratio will be 5% (in other words, the difference between the interest rates of the 2 instruments of your chosen pair will expand by 5%).
You would earn $2,500 a year! (2,500 is 5% of 50,000) Just by investing in interest rate changes and ratios. $2,500 is 25% of your original, initial investment in this position!
There are 3 possibilities here:
- If the currency you are buying crashes and loses value, you would lose your investment (regardless of the “carry trade” system. You would lose because the currency has lost more value than what you would earn from the interest rate difference).
- If the traded pair more or less keeps its value, having a stable year without changes, you will profit from the 5% differential ratio! This is the purpose of Carry Trade. Make money out of interest rates, not price movements on charts.
- If the currency you are buying strengthens and its value increases, you win twice! Both from the 5% differential ratio and the stronger value of the pair in the market.
Important: You need to pay attention that if the differential ratio of a certain pair when you buy it equals #%, it means that if you wish to sell it (buy the counter currency by selling the base currency), the ratio is inverted (-#%).
For example, as the interest rates stand in July 2016, if the differential ratio of NZD/JPY when buying NZ Dollars is 0.2.60%, it would be -2.60% if you decide to open a Sell position for this pair, meaning, buying yens by selling dollars.
Carry trade is a recommended trading method for low-risk currencies, which represent strong markets with stable economies. How should we choose the right pair?
In a carry trade:
- Borrow: You borrow money in a currency with a low interest rate (like the Japanese Yen).
- Invest: You convert this money into a currency with a high interest rate (like the Australian Dollar).
- Earn Interest: You earn interest on your investment.
- Repay: After a certain period, you sell the high-interest currency and use the proceeds to repay your loan.
If the exchange rate stays the same or moves in your favor, you’ll make a profit. However, if the exchange rate moves against you, you could lose money. Remember, Carry trades involve risk, and it’s important to understand the potential downsides before trying them.
First, we look for a pair with a relatively high differential ratio. The pair should already have been stable for a long period. Uptrend current conditions are preferred, especially if the stronger currency of the two is the one to strengthen. We would want to choose a pair that consists of a currency with relatively a very high interest rate that is expected to rise even more shortly; and on the other hand, a currency with relatively a very low interest rate (for example, NZD or JPY), which is expected to maintain the same level shortly.
Remember: Popular pairs for Carry Trade right now are:
- AUD/JPY: Australian Dollar/Japanese Yen
- NZD/JPY: New Zealand Dollar/Japanese Yen
- EUR/JPY: Euro/Japanese Yen
- USD/JPY: US Dollar/Japanese Yen
Look at the next example of the NZD/JPY

Chart:
This is a daily chart (each candle represents a day). You will notice a strong bullish trend since bottoming out after the Brexit referendum.
Also, we know that the interest on JPY in 2016 is -0.10. The interest rate on the NZD at the same period is 2.25%, with a good potential to rise. Meaning, we have here a pair with a high differential (buying New Zealand Dollars with a 2.25% interest rate while selling Japanese yen with a -0.1% interest rate.
The differential rates add up to 2.35% interest!). Besides, notice the high profits you could have made just on the bullish trend of the pair itself!
Swing trading or benefiting from interest rates is one of the advantages of forex that other financial markets, such as indices or commodities, don´t offer. Buying separate stocks is pretty similar because the dividend replaces the interest rate.
Key Components of the Carry Trade
The carry trade is a popular Forex trading strategy that involves borrowing money in a currency with a low interest rate and investing it in a currency with a higher interest rate. The goal is to profit from the difference in interest rates, known as the “carry.” This strategy can be particularly appealing in a low-interest-rate environment, where traders can take advantage of low borrowing costs.
- Interest Rate Differential: The primary factor driving carry trades is the interest rate differential between the currencies involved. Traders look for currencies that offer a significant interest rate spread. For example, borrowing in Japanese Yen (JPY), which has had historically low rates, and investing in Australian Dollar (AUD), which typically offers higher yields.
- Market Conditions: Carry trades often perform well in stable, low-volatility markets where investors feel confident. Economic conditions that promote growth and stability can lead to rising interest rates in the target currency, enhancing profits from the trade.
- Risk Management: While carry trades can be lucrative, they come with risks, especially currency volatility and potential economic downturns. If the value of the invested currency decreases, the losses can offset the interest income. Thus, it’s crucial to implement proper risk management techniques.
- Economic Indicators: Monitoring economic indicators, such as inflation rates, GDP growth, and central bank policies, is essential. A change in economic conditions can prompt a shift in interest rates, directly affecting the profitability of carry trades.
- Hedging Options: Traders may also use options or futures to hedge against potential losses from currency fluctuations while engaging in carry trades.
The carry trade is a great alternative fundamental strategy for Forex traders looking to capitalize on interest rate differentials. It requires a thorough understanding of market dynamics, economic indicators, and effective risk management practices.
For more detailed insights and strategies related to carrying trades, you can refer to resources like Investopedia and BabyPips.

Practice
Go to your practice account and let’s practice the subjects we just learned:
- Try to find on the platform some situations where two different indicators show opposite signals on the same chart
- Try to identify Elliott Wave patterns and trade by them
- Use the Swing Trade method and open positions based on it
- Trade by using the Divergence Trading strategy (Regular and Hidden). Choose which indicator to work with
- Look for Breakout points according to what you have learned
- Open two positions simultaneously (on two different pairs) according to the fundamental Currency Correlation strategy
Revision Questions
- What is an “Elliott Wave“? What does a pattern look like? Write down the rules and conditions; Identify the 8 waves (stages) on the following chart:

- Correlation: In which cases is there no point in using this method?
- Carry Trade: In what do we invest when using this technique? How do we choose a pair to Carry Trade with?
Answers
- Wave #2 would never be longer than wave #1.
Wave #3 would never be the shortest of the first 5 waves (First trend).
Wave #4 would never enter Wave #1’s price range. Assume an uptrend – it will always end at a higher point than wave #1’s top.


- When correlation is absolute negative/positive, or almost absolute, meaning, correlation equals 1 or -1, or close; when correlation equals 0, there is no relationship between the two currencies.
- We invest in interest rate differentials between two currencies. A good pair to carry trade on would have a high differential ratio, which is expected to increase.
Stocks offer dividends which can be considered as interest rates. This presents us with the opportunity to use the ‘carry trade strategy’. You buy shares in a company with a higher dividend and better outlook while selling shares of another company with a lower dividend and less favorable outlook.
In Chapter 10 – Risk and Money Management you will learn how to manage your money properly to maximize your profit while minimizing your risk.

Sidebar rates
