How to Use Parabolic SAR in Forex
What is the Parabolic SAR?
The Parabolic SAR stands for parabolic stop and reverse and is a widely-known tool used by traders, mainly in the forex market, to determine the end of a trend of a given security. The indicator can easily be applied to any trading strategy, allowing a trader to determine where stop orders should be placed.
Understanding The Parabolic SAR
The parabolic SAR indicator was built to determine the end of a trend, which, in return, automatically marks the beginning of a new trend. Hence, the parabolic SAR indicator is very easy to use and works best in trending markets.
With displaying graphic dots above or below the price movements of the security, the parabolic SAR indicator either indicates bullish or bearish momentum respectively. If the security is trending up, the parabolic SAR shows a dot below the price candles. If the market is trending down the dot is positioned above the price candles in the chart.
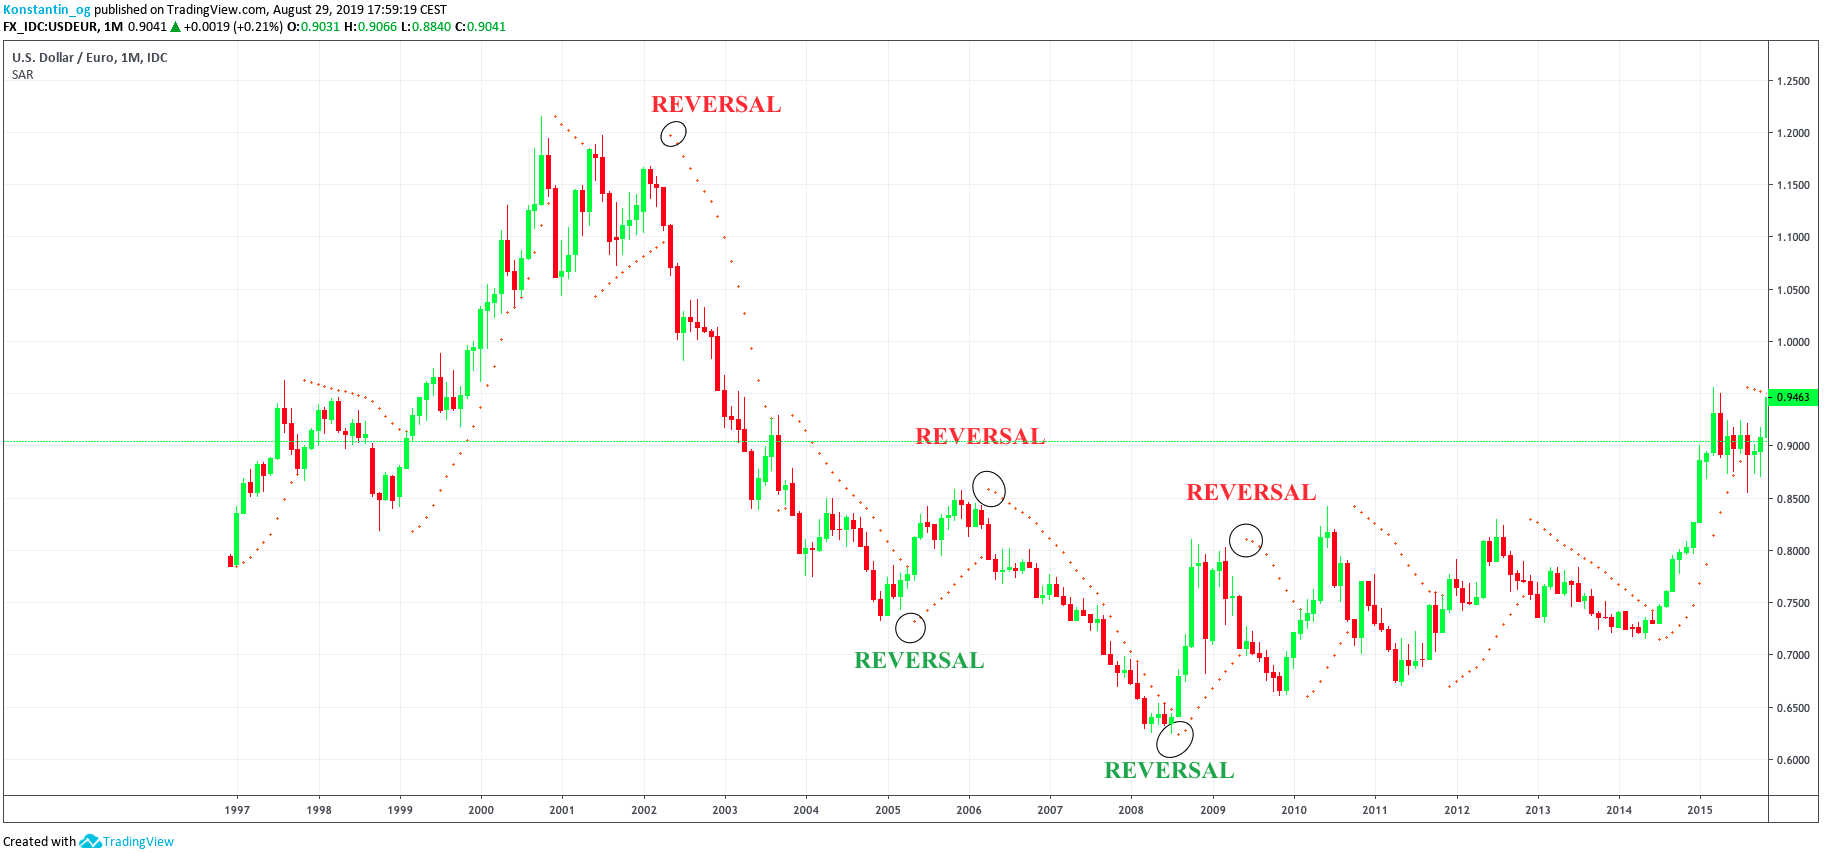
In the example above, you can see that bullish or bearish signals are generated when the position of the dots reverses direction and is placed on the opposite side of the price.
It is important to realize that using the parabolic SAR indicator by itself can often result in prematurely entering or exiting a position. Consequently, it might be more useful for traders to place their stop-loss orders at the SAR value, because a move exceeding it signals a potential reversal, resulting in the price moving in the opposite direction, of which a trader could take advantage. In case of a continuation of the trend, the parabolic SAR is normally far enough separated from the price. This enables the trader to ride the trend as long as it goes, as it prevents the trader from being stopped out of a position on passing retracements that inevitably occur during a long-term trend. As a consequence, the trader can book more profits.
Markets and the Parabolic SAR
Another key point to understand is that the parabolic SAR works best in trending markets and not in choppy or sideways markets. If the market ranges from one level to the other without a steady trend, the parabolic SAR tends to generate false trading signals. As this would lead to losses, it is wise to use the parabolic SAR in combination with the average directional index (ADX) momentum indicator to obtain a more accurate assessment of the strength of the existing trend. Furthermore, factoring candlestick patterns or moving averages is also a thing traders could think about. For example, the price falling below a moving average or support level can be taken as an additional confirmation of a sell signal given by the parabolic SAR.
How to Use Parabolic SAR
Well-timed entries are important and so are well-timed exits. While it is important to know when a trend starts, it is equally important to know when to exit a position. To sum the parabolic SAR indicator up, you can use this as a rule:
-When the dots are below the price candles, it is a bullish signal.
-When the dots are above the price candles, it is a bearish signal.
It is as simple as that.
The parabolic SAR indicator is probably one of the easiest indicators to read because it does not indicate anything more than that the price is either going up or down.
How to Use Parabolic SAR to Exit Trades
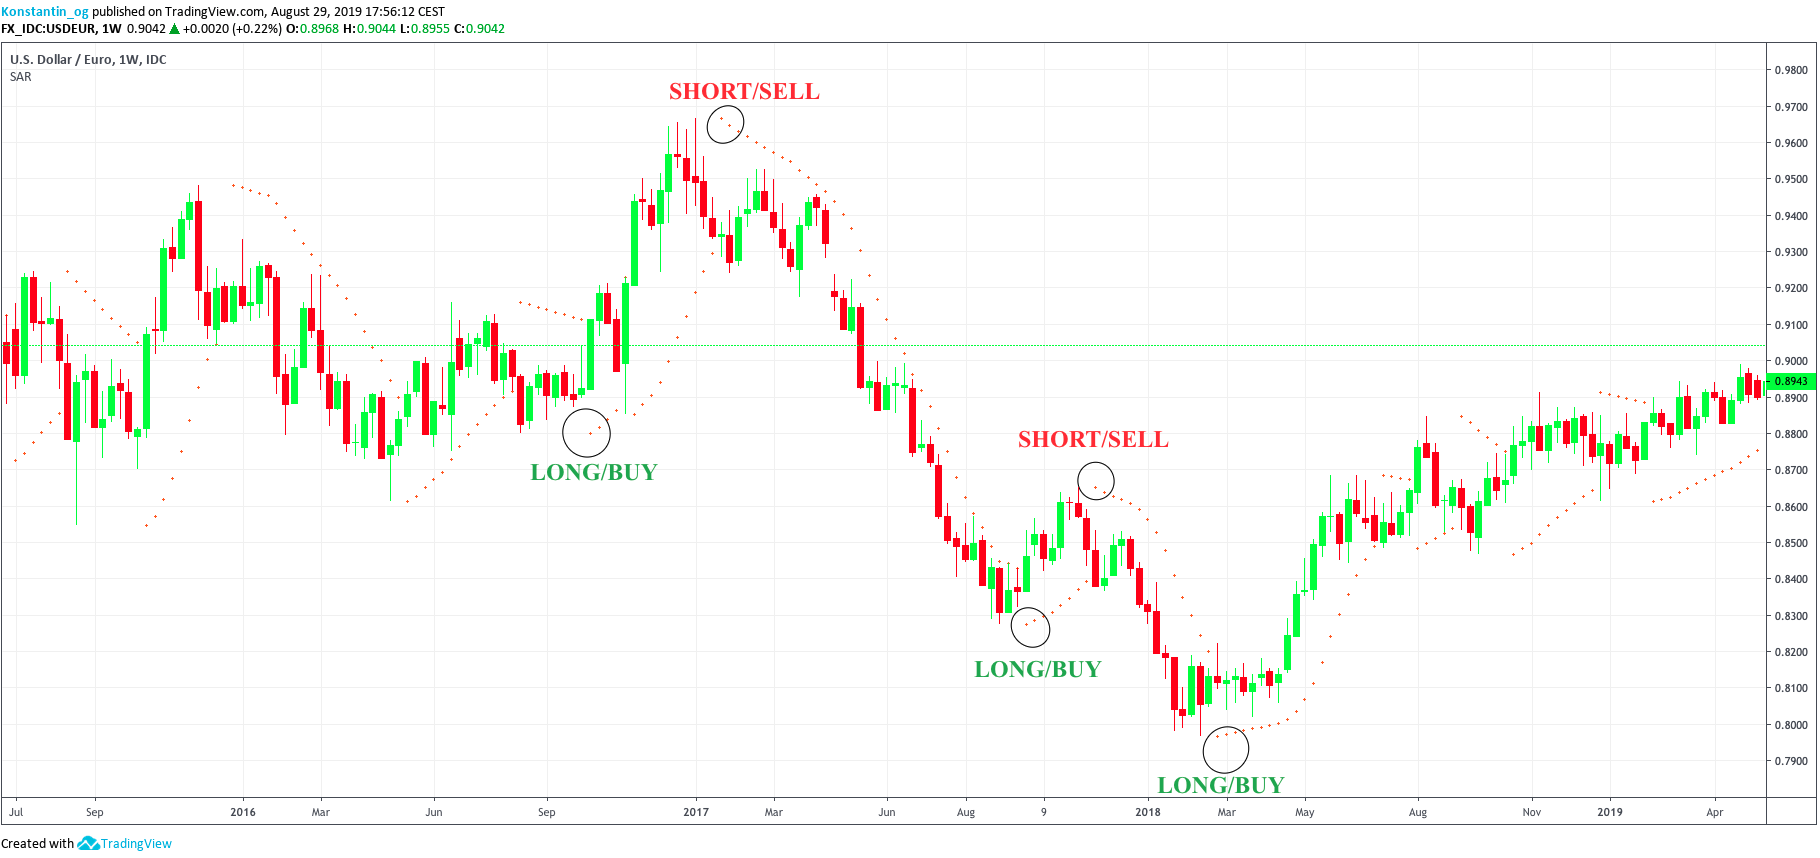
When USD/EUR started to decline at the beginning of 2017, it seemed like it would just keep dropping sharply.
A trader who would want to take advantage of that and open a short position would be interested in knowing how long the downturn would last. In that case, he would close his short position when the parabolic SAR indicator reverses its signal. When the dots appear below the price chart again, it would have been time to close the short position.
Limitations of the SAR Indicator
So if you wonder how you can combine different indicators with the parabolic SAR indicator to have better and more accurate signals, you might take a look at the chart below.
What you can see here is that the combination of the parabolic SAR and the RSI gives us a quite good accuracy:
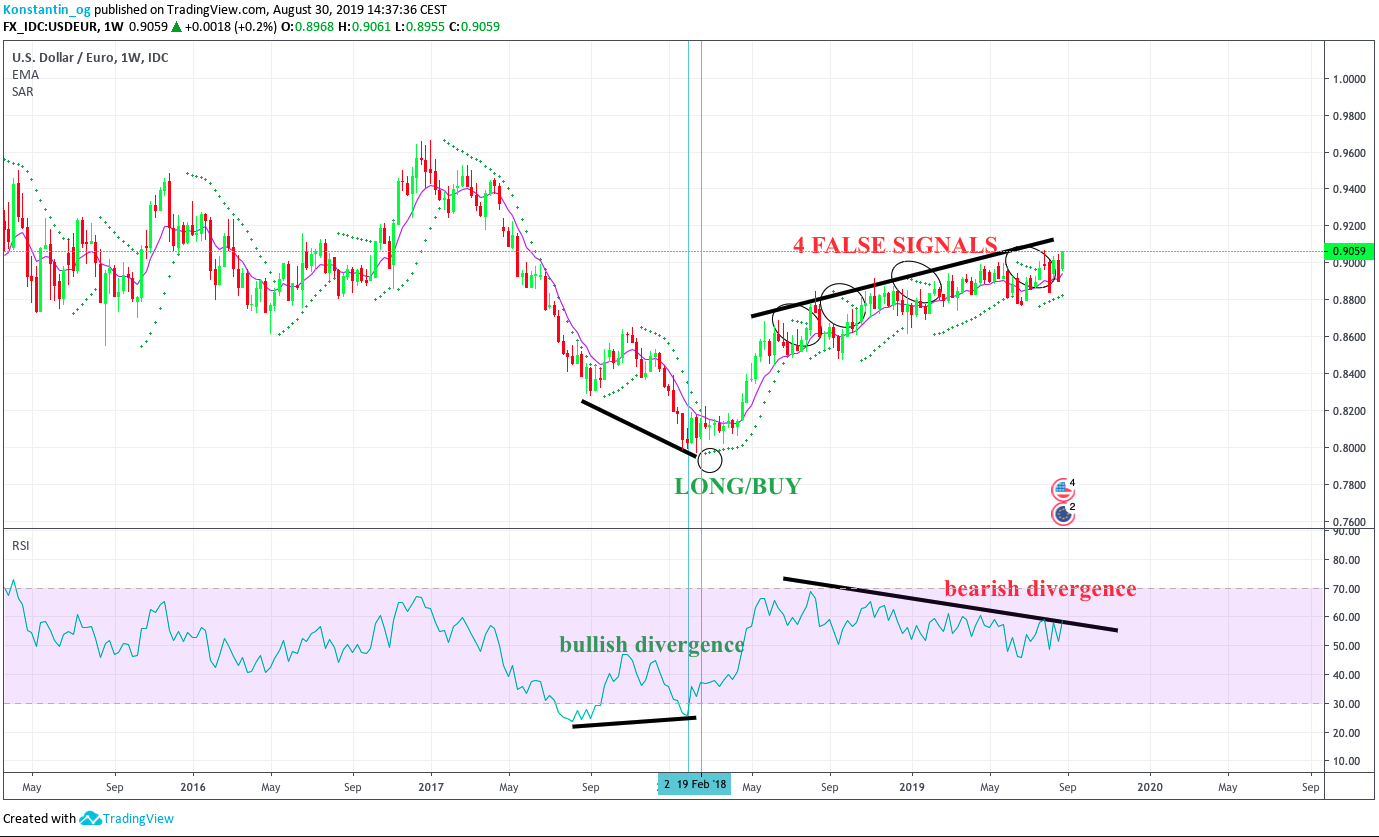
When the RSI showed a bullish divergence in oversold regions, the SAR indicator shifted from bearish to bullish shortly after. Then, the trend went up for a continuous period. While the SAR indicator gave us four false signals during this period, the RSI was losing strength and showed an ongoing bearish divergence. However, as the RSI didn’t touch overbought regions yet, traders could wait for that in addition to a shift of the parabolic SAR indicator to exit the long position. Having said that, the ongoing bearish divergences hints that a sell-off might be around the corner, as the RSI is losing strength and yet the price still tends to climb higher. Thus, the 4 false signals could also hint us towards an upcoming decline in price.
Sidebar rates
Ava

