Forex News and Market Analysis
Tuesday, July 7, 2026

SanDisk shares extended their sharp decline as a broad semiconductor selloff, weakening sentiment ac ...
2 hours
Intel shares have extended their decline toward the $100 level as a broad semiconductor selloff over ...
3 hours

Micron shares fell sharply below the $900 level as weakness across semiconductor stocks dragged down ...
3 hours

Mahindra & Mahindra (M&M) stock started the day on a weak track and is showing mixed to nega ...
7 hours


ETH is back testing $1,800 again, ...
8 hours

INTC (Intel) stock started the day on a bullish track and is still showing positive performance in t ...
8 hours
Gold Price Forecast: 57k NFP Labor Shock Triggers Historic Short-Squeeze Back Above $4,120
3 min read

The global precious metal markets took a sudden, violent structural r ...
10 hours

Hindalco Industries stock showed good movement on July 6, 2026, as this stock hit the level of 980 a ...
11 hours
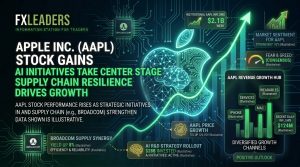
Apple AAPL stock maintained its bullish trend and is still showing strong performance in the Asian t ...
12 hours

Nasdaq 100 futures (NQ) hav ...
12 hours
Bullish Silver Forecast: Dual Shocks from China Export Rules and US Strategic Reclassification
2 min read

...
12 hours

Bitcoin is currently trading in the mid-to-high $60k range ...
12 hours

The Dow Jones Industrial Average and its corresponding futures (YM) are trading at historic highs, h ...
13 hours

Rivian shares surged above $20 after strong delivery data and upbeat revenue guidance, but a 75 mill ...
14 hours

Newmont Corporation (NEM) Stock managed to stop its previous bearish performance and gained some fre ...
14 hours
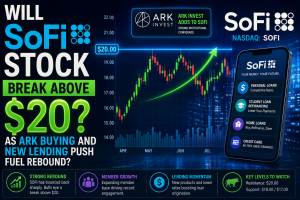
SoFi shares climbed as investors reacted to Cathie Wood’s fresh buying, CEO insider purchas ...
14 hours
Will TeraWulf (WULF) Stock Break Above $25 After Anthropic’s $19 Billion AI Data Center Deal?
3 min read

TeraWulf shares jumped after the company signed a 20-year AI infrastructure lease with Anthropic, bu ...
15 hours

Dell Technologies shares jumped more than 4% after President Trump again promoted the compa ...
17 hours

Walmart shares slipped despite broader market strength as investors weighed aggressive groc ...
18 hours
When it comes to the markets, staying abreast of important economic events and breaking news
items is a full time job. Whether one is an active day trader or a long-term investor, the need to be current is one that must be satisfied every
single day. The FX Leaders news feed is a great way to stay on top of the evolving global
marketplace.
Everything You Need In An FX News Service
All Things Forex News, 24 Hours A Day, 5 Days A Week
Sidebar rates
