Forex News and Market Analysis
Saturday, July 4, 2026

Ethereum coin extended its previous session's bullish rally and remained well bid around the $1,756 ...
6 hours
Gold Price Rallies Above $4,185 as Weak US Jobs Data and Middle East Tensions Boost Demand
2 min read

During the early European trading session, Gold (XAU/USD) prolonged its bullish rally and drew some ...
7 hours
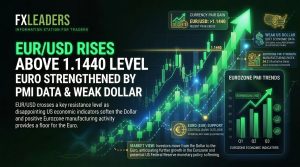
During the early European trading session, the EUR/USD currency pair maintained its bullish trend an ...
8 hours
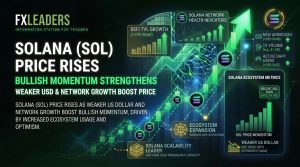
Solana (SOL/USD) coin maintained its upward trend and remained well bid around above $82.33 level in ...
9 hours

Bitcoin (BTC/USD) extended its bullish bias and is still showing gains in the Asian trading session. ...
9 hours


Sa ...
11 hours

Micron on Saturday broke ground on the expansion of its factory in western Japan, a ¥1.5 trillion ($ ...
11 hours

South African motorists are receiving significant fuel price relief in July as lower global oil pric ...
18 hours
Investors are closely watching earnings from Microsoft, Meta, and Alphabet as their AI capital spend ...
18 hours
Central Banks Increase Gold Focus Despite XAU Retreat, Over US Debt and Dollar Dominance Concerns
2 min read

Gold is attracting renewed interest from central banks and sovereign wealth funds as concerns over r ...
19 hours

JPMorgan has warned that the widening performance gap between Meta Platforms, Microsoft, Amazon, Alp ...
19 hours

During the US trading session on Friday, the Microsoft stock (MSFT) maintained its previous session' ...
21 hours

During the US trading session, this NVIDIA stock extended its previous session bearish trend and is ...
1 day
Ethereum Price Forecast: Ethereum Eyes $1,750 Breakout as L2 Scaling Defies Fed Headwinds
3 min read

...
1 day
...
1 day
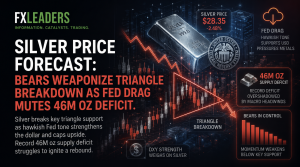
Silver Price Forecast: Bears Weaponize Triangle Breakdown as Fed Drag Mutes 46M Oz Deficit
4 min read
...
1 day
...
1 day

Bitcoin climbed back above $61K e ...
1 day

On Friday, the CoreWeave stock failed to stop its bearish trend and remained under pressure around t ...
1 day
When it comes to the markets, staying abreast of important economic events and breaking news
items is a full time job. Whether one is an active day trader or a long-term investor, the need to be current is one that must be satisfied every
single day. The FX Leaders news feed is a great way to stay on top of the evolving global
marketplace.
Everything You Need In An FX News Service
All Things Forex News, 24 Hours A Day, 5 Days A Week
Sidebar rates
Ava

