Forex News and Market Analysis
Sunday, July 12, 2026
Super Micro Computer (NAS ...
9 hours

IREN (NASDAQ: IREN) has ...
9 hours

B ...
10 hours

Micron Technology ( ...
10 hours

...
10 hours
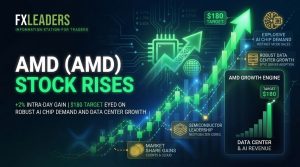
During the European trading session on Saturday, the Advanced Micro Devices (AMD) stock maintained i ...
1 day

Bitcoin (BTC) continues to show mixed performance and is expected to end this week on a bearish trac ...
1 day
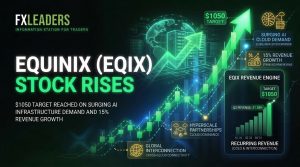
During the early European trading session on Saturday, Equinix (EQIX) stock maintained its upward tr ...
1 day

...
1 day

Aspen Share Price JSE: APN Regains Momentum as Exec Governance Overhaul Improves Sentiment
4 min read

Aspen Pharmacare shares have continued to recover despite weaker interim earnings, as investors incr ...
2 days
Will the €10 Support Hold for Nokia Stock as Investors Remain Sceptic of AI and 6G Plans?
4 min read

Nokia shares remain under pressure as investors weigh the company's long-term AI ambitions against s ...
2 days

Netflix shares remain under pressure as slowing subscriber growth, intensifying competition, weaker ...
2 days

Expectations for lower expert flows kept natural gas prices low i ...
2 days
SoFi Stock Attempts A Trend Reversal on Expansion but Needs to Break $20 Ahead of Earnings Test
3 min read

SoFi Technologies stock has staged an impressive recovery from their 2026 lows as investors increasi ...
2 days

Stock indices may be flat on Friday, but lubricant giantWD-40 (WD ...
2 days

On Friday, as the stock market opened in the United States, the major indices remained mostly fl ...
2 days

During the early US trading session on Friday, Amazon (AMZN) is showing mixed performance and tradin ...
2 days

During the early European trading session on Friday, the Meta Platforms (META) stock maintained its ...
2 days

During the European trading session on Friday, the Advanced Micro Devices extended its previous sess ...
2 days
When it comes to the markets, staying abreast of important economic events and breaking news
items is a full time job. Whether one is an active day trader or a long-term investor, the need to be current is one that must be satisfied every
single day. The FX Leaders news feed is a great way to stay on top of the evolving global
marketplace.
Everything You Need In An FX News Service
All Things Forex News, 24 Hours A Day, 5 Days A Week
Sidebar rates
