Forex News and Market Analysis
Sunday, June 28, 2026
...
3 hours


Bitcoin (BTC) coin managed to recover some of its losses and gained modest traction around above the ...
20 hours
SpaceX Stock Falls After Hitting Record High Despite Strong Starlink Growth and Rocket Expansion
2 min read

SpaceX company stock extended its previous long downward performance and is still showing losses on ...
22 hours

Despite the fact that a lot of negative news is circulating in the market, the Ripple (XRP) coin man ...
22 hours
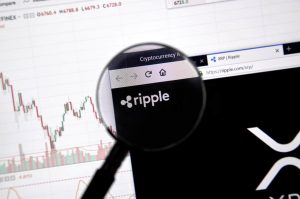
Recent developments involving Visa and XRP-related infrastructure were brought to light by Levi Riet ...
1 day

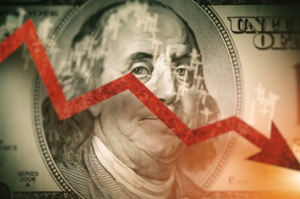
The global silver market is currently locked in an extraor ...
1 day

Despite the strong performance in its South African operations, FirstRand's rise lost steam when UK ...
1 day

Significant fuel price reductions are anticipated for South African drivers in July as the temporary ...
1 day
APLD Stock Ends Week Under $40 as Nvidia Exit and Valuation Fears Shake Investor Confidence
3 min read

Applied Digital shares have come under renewed pressure after failing to break above record highs, w ...
2 days
Nokia Stock to Head to $10 after Breaking Support as Transformation Effort Faces Growing Scrutiny
4 min read

Nokia shares remain under pressure as fading enthusiasm around AI-driven growth, weakening legacy op ...
2 days
Oracle Adds 10 Defense Companies to Ecosystem to While Stock Dips on OpenAI IPO Rescheduling
2 min read

Oracle (ORCL) will be adding 10 more defense companies to the Oracle Defense Ecosystem, but the ...
2 days
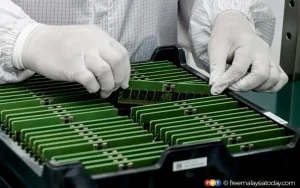
Micron Technology (MU) Stock Jumps 15% After Record Q3 Earnings as AI Memory Demand Soars
2 min read
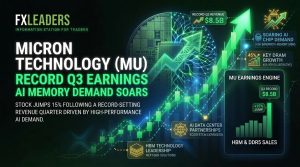
Micron Technology company stock is showing very good performance and is still showing strong gains o ...
2 days

The institutional framework that supports top-tier digital infrastructure assets has shown heavy mul ...
2 days

The global energy complex has been rapidly reshaped by structural forces over the past week, leaving ...
2 days

Global commodity derivatives markets are resetting their structural foundations, and alternative har ...
2 days

Market for global precious metals is going through a major technical consolidation period in a delic ...
2 days
OpenAI May Delay IPO after SpaceX Stock Drop
2 min read

OpenAI was supposed to launch its initial public offering (IPO) sometime in 2026, and the compan ...
2 days

Broadcom (AVGO) stock failed to stop its previous downward rally and is still showing poor performac ...
2 days
When it comes to the markets, staying abreast of important economic events and breaking news
items is a full time job. Whether one is an active day trader or a long-term investor, the need to be current is one that must be satisfied every
single day. The FX Leaders news feed is a great way to stay on top of the evolving global
marketplace.
Everything You Need In An FX News Service
All Things Forex News, 24 Hours A Day, 5 Days A Week
Sidebar rates
