Palantir Stock (PLTR) Down Big — Can It Recover After 41% Drop?

Quick overview
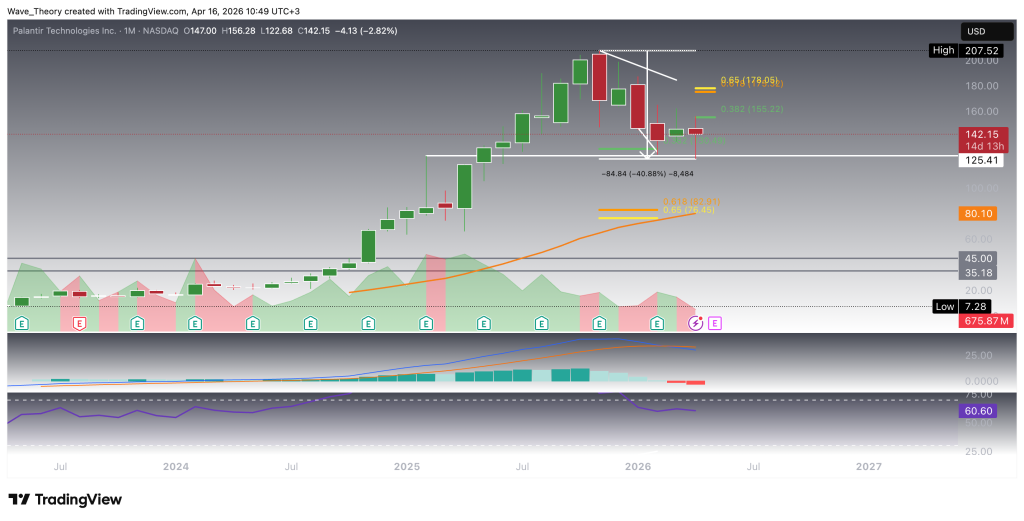
- Palantir (PLTR) has experienced a 41% decline over the past six months, currently testing a critical support level at $125.4.
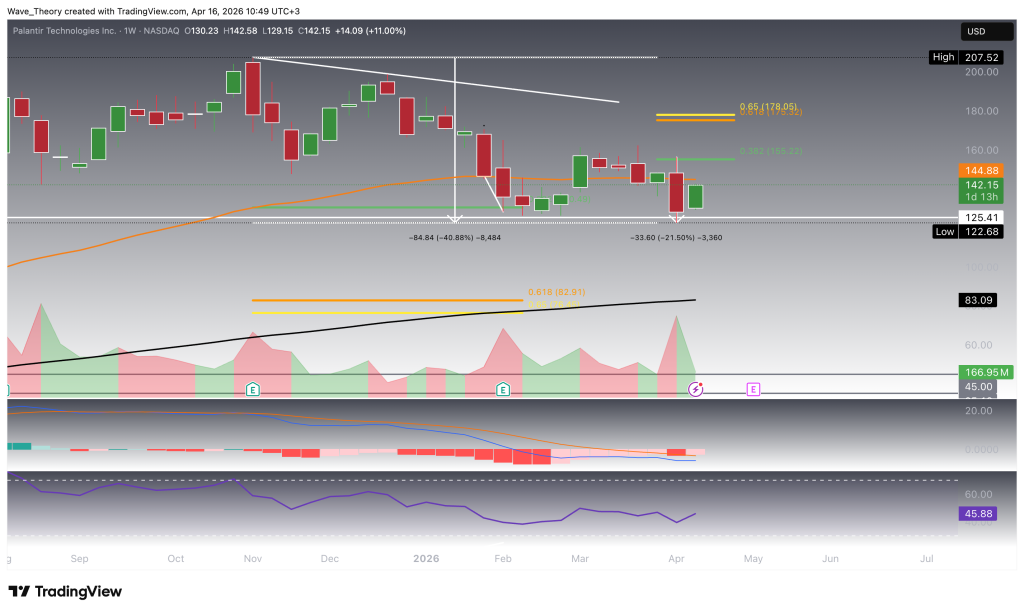
- The stock faced rejection at the 0.382 Fibonacci resistance near $155, leading to a significant 21.5% drop last week.
- Despite a bearish trend indicated by a death cross on the daily chart, early signs of recovery are emerging with improving momentum indicators.
- Key resistance levels to watch include $145, $155, and $178, which will be crucial for determining the potential for a sustained bullish move.
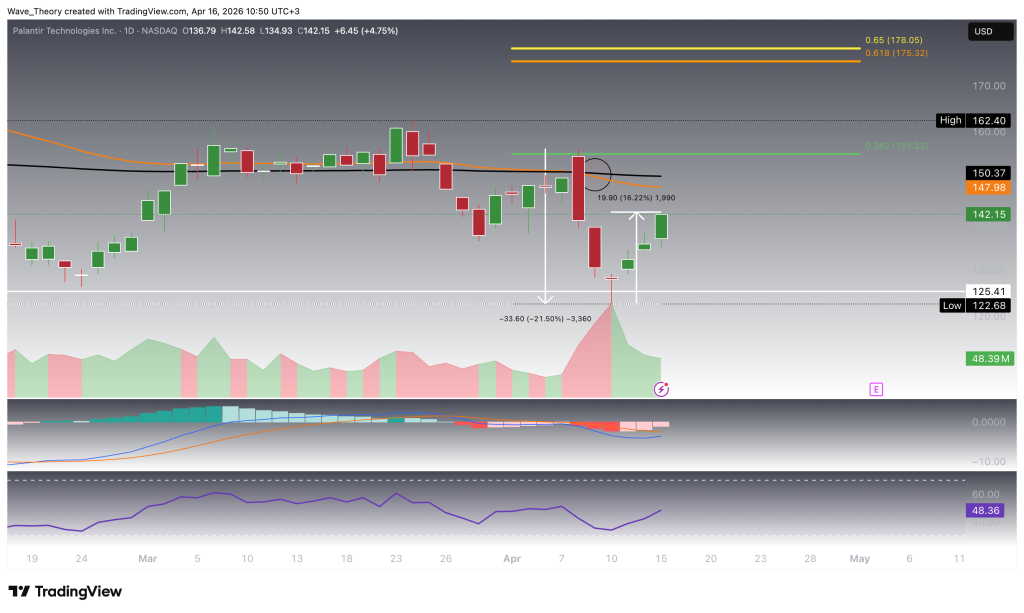
Palantir Stock Forms Death Cross on the Daily Chart
On the daily timeframe, Palantir (PLTR) has confirmed a death cross in its EMA structure, signaling a bearish trend in the short- to medium-term horizon. This negative trend alignment is further supported by momentum indicators, as the MACD lines remain bearishly crossed, reinforcing the prevailing downside pressure. Meanwhile, the RSI continues to trade in neutral territory, offering no clear directional bias and suggesting that the stock is not yet in oversold conditions.
Despite this bearish framework, early signs of a potential recovery are emerging. The MACD histogram has been ticking higher over the past three days, indicating improving momentum, which coincides with a sharp price rebound of approximately 16.2%. This divergence suggests that bullish momentum is beginning to build, even as the broader trend remains negative.
Should this upward move extend, Palantir is likely to encounter significant resistance in the $148 to $150.4 range, representing a near-term supply zone. Beyond that, the next key Fibonacci resistance levels are located at $155.2 and $178, which will serve as critical barriers for any sustained recovery and potential trend reversal.
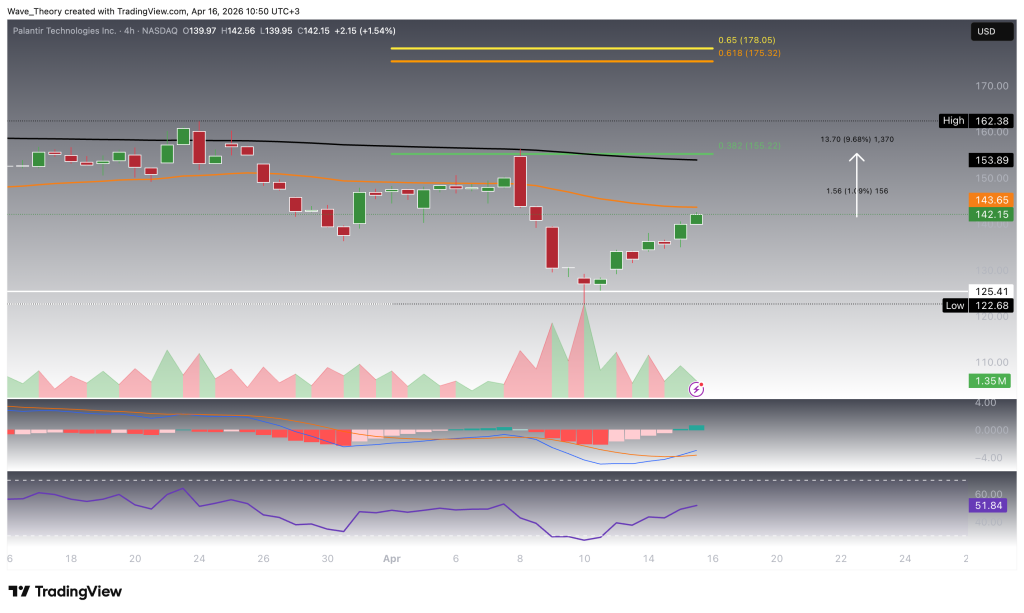
More Upside Potential on the 4H Chart of Palantir (PLTR)
On the 4-hour timeframe, Palantir (PLTR) continues to reflect a mixed but improving short-term setup. The EMA structure still displays a death cross, confirming that the immediate trend remains bearish. However, momentum indicators are shifting constructively: the MACD lines are bullishly crossed, and the MACD histogram is trending higher, signaling strengthening upside momentum. Meanwhile, the RSI remains in neutral territory, indicating no immediate overbought conditions and leaving room for further upward movement.
From a price action perspective, Palantir has limited near-term upside of approximately 1% before encountering the 50-period EMA resistance on the 4H chart at $143.65. A sustained move beyond this level could open the path toward the next major resistance confluence at the 200-period EMA and the 0.382 Fibonacci level near $154, representing roughly 10% upside from current levels. These zones will be critical in determining whether the current recovery attempt can evolve into a more sustained bullish move or stall within the broader corrective structure.
Palantir at a Critical Support Zone – Key Levels to Watch
Palantir (PLTR) remains in a broader corrective phase after a ~41% decline, now testing a major historical support at $125.4 for the second time. While higher timeframe momentum remains bearish, short-term indicators show early signs of stabilization and potential recovery, though the overall structure is still fragile.
Key support levels:
$125.4 – Historical support (critical level)
Key resistance levels:
$143.65 – 50-4H EMA (near-term resistance)
$145 – 50-week EMA
$148–$150.4 – Immediate resistance zone
$155.2 – 0.382 Fibonacci resistance
$154 – 200-4H EMA confluence
$178 – Golden ratio (trend-defining breakout level)
$207.5 – All-time high target
Scenario:
Holding above $125.4 keeps the rebound scenario intact, with upside potential toward $145–$155.
A confirmed breakout above $155 and especially $178 would invalidate the correction and open the path toward $207.5.
Failure to hold $125.4 would signal continuation of the correction and likely lead to further downside.
Bottom line:
Palantir is at a decisive level, where early bullish momentum is attempting to counter a still-dominant corrective trend. The reaction at $125.4 and behavior around $145–$155 will determine whether a sustainable recovery can unfold.
- Check out our free forex signals
- Follow the top economic events on FX Leaders economic calendar
- Trade better, discover more Forex Trading Strategies
- Open a FREE Trading Account
- Read our latest reviews on: Avatrade, Exness, HFM and XM
Related Articles

Sidebar rates
Related Posts
