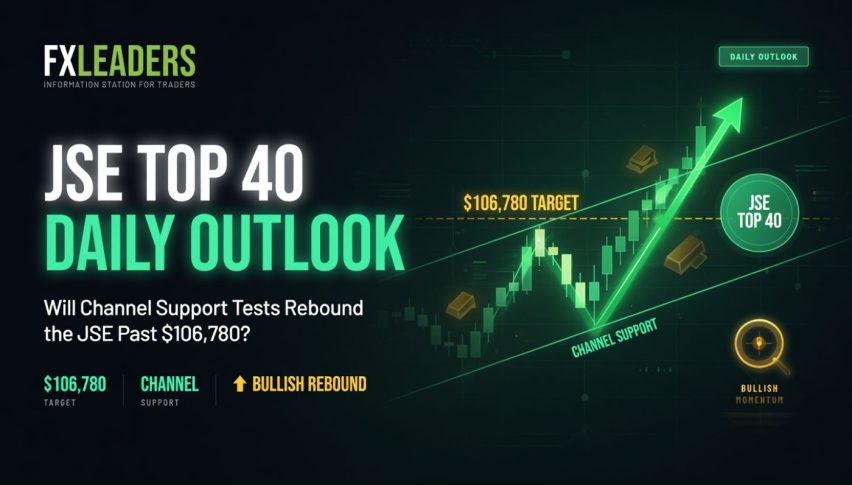
JSE Top 40 Daily Outlook: Will Channel Support Tests Rebound the JSE Past $106,780?
On Wednesday, the FTSE/JSE Top 40 Index (JTOPI) hit 105,814.50 index points after a slight local intraday cooldown of 0.21%...
Quick overview
- The FTSE/JSE Top 40 Index reached 105,814.50 points, showing a slight intraday decline of 0.21%.
- Long duration commodity stocks are providing a fundamental backstop for the index, supported by significant purchases of gold by the People's Bank of China.
- Canal+ boosted Bourse liquidity with its secondary listing on the JSE Main Board, marking a significant event for the exchange.
- The market is under pressure from high U.S. inflation and a strong dollar, affecting domestic financials and consumer sectors.
On Wednesday, the FTSE/JSE Top 40 Index (JTOPI) hit 105,814.50 index points after a slight local intraday cooldown of 0.21%. The commodity-laden benchmark is getting close to the bottom edge of the significant parallel downward trend line on the 4H time frame as it tries to balance defensive local retail flows with the enormous tailwinds present within the South African mining complex.
Important drivers today
- 17-month central bank commodity anchorage: Long duration commodity stocks are acting as a reliable fundamental backstop for the index. The People’s Bank of China has purchased physical gold in bulk for the last 17 months, with a long list of South African precious metals and resource names like AngloGold Ashanti and Gold Fields gaining from this trend as an institutional support level and a fundamental backstop for macro index sell-offs.
- Canal+’s secondary listing: Today saw Bourse liquidity and breadth get a boost when the French giant Canal+ did a secondary listing on the JSE Main Board after its massive buyout of pay-TV company MultiChoice. Ticker symbol CNP means this French company is the first in the group to go with the JSE’s expedited process and it offers direct rand exchange exposure to a global media company.
- Restrictive Warsh environment: Financials in the short term domestic environment are struggling under pressure from the U.S. Dollar Index (DXY). U.S. inflation was still high in April with headline CPI at 3.8% and core CPI at 4.1%. With Kevin Warsh still chairing the Fed, this means the dollar is stuck in “higher for longer” regime, which continues to add pressure on the Rand, supporting resource export revenues and pressurizing consumer sectors.
Technical chart analysis
The 4H chart is showing a bearish continuation pattern. It has stayed within a neat parallel downward trend line, having made a series of lower highs in the lower end of black and red trend lines. It’s currently pressing into a strong horizontal support zone 104,208 to 105,814. The green corrective candles are making their way up but they have strong tails on them which suggests that distribution is defending at these zones around the intermediate moving averages.
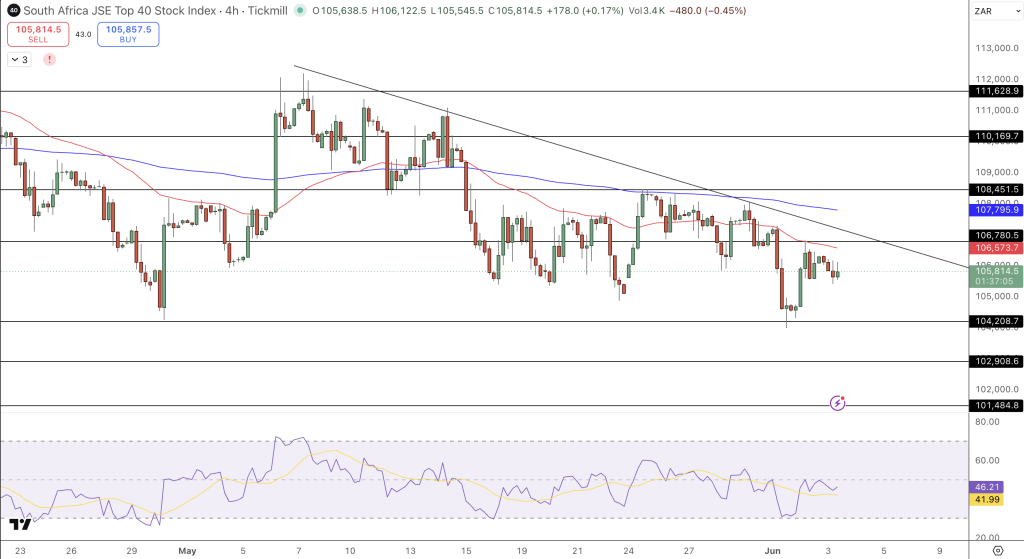
The 14-period relative strength index (RSI) sits comfortably in the middle with no significant divergence in the momentum and it looks like the sideways consolidation is compressing at the edge of the channel and volume has become quite tight, possibly indicating that sellers are losing momentum.
Resistance: 106,780.00 (immediate breakout point), 108,451.00 (upper end of channel) and 110,169.00 (pattern high). Support: 105,814.50 (local support), 104,208.00 (channel base) and 101,350.00 (channel low).
Trade idea
Watch for an immediate counter trend bounce if price hits the immediate lower support on the 4H.
Buy Stop above 106,780.00 with targets of 108,451.00 (T1) and 110,169.00 (T2) and a stop loss just below the lower support channel at 104,208.00.
Conclusion
Our short-term JSE Top 40 price forecast suggests a highly compressed, ranging, market structure and the index is attempting to find a bounce near the bottom of the pattern parameters. With long duration resource backstops and the latest new listings from multinational firms, Africa’s biggest exchange is still fundamentally resilient. However, domestic interest rates and inflation are pressuring the market. Be careful at these short-term support and resistance levels and stay on the side lines until you get a clear close to determine which direction the market will rotate toward.
- Check out our free forex signals
- Follow the top economic events on FX Leaders economic calendar
- Trade better, discover more Forex Trading Strategies
- Open a FREE Trading Account
- Read our latest reviews on: Avatrade, Exness, HFM and XM
Related Articles


Sidebar rates
Related Posts
