Gold Price Daily Outlook: Will Critical $4,518 Support Buckle Under Channel Pressure?
Spot gold (XAU/USD) is in a period of highly compressed technical testing on Tuesday, currently sitting at $4,520.58.
Quick overview
- Spot gold (XAU/USD) is currently trading at $4,520.58, showing minimal movement as it remains within a descending parallel channel.
- The restrictive Federal Reserve monetary policy is impacting gold prices, with no expected interest-rate reductions in the near future.
- Official-sector accumulation, particularly by the People's Bank of China, is providing some support for gold despite ongoing selling pressure.
- A reactive trend-following setup is forming, with a potential sell stop order at $4,518.00 as the market tests key support levels.
Spot gold (XAU/USD) is in a period of highly compressed technical testing on Tuesday, currently sitting at $4,520.58. This represents a minimal 0.04% intraday move as the metal stays tightly contained within a clearly-defined descending parallel channel on the two-hour timeframe, where extreme compression persists as record levels of official-sector accumulation struggle to counter the restrictive interest rate environment.
Key Catalysts
- The Warsh Macro Paradigm: The world economy is responding directly to restrictive Federal Reserve monetary policy under the leadership of Chairman Kevin Warsh. With April data underscoring the inflation problem (headline CPI at 3.8%; Core CPI at 4.1%), global trading houses have abandoned all hopes for interest-rate reductions in the coming months, boosting real rates and putting a ceiling on bullion.
- The 17-Month Bullish Fundamentals: Official-sector accumulation remains a vital bullish underpinning that is limiting selling pressure and preventing any meaningful deleveraging. The People’s Bank of China has purchased gold for an unprecedented 17 consecutive months and continues buying physical alongside other second-tier nations that are absorbing retail liquidation volume.
- Ceasefire Pressure: U.S.-Iran truce still remains in place after nine weeks, normalizing commercial traffic through the Strait of Hormuz. The truce is taking away a good deal of the geopolitical premium that was earlier supporting bullion, but the agreement is still very precarious.
Technical Analysis
The two-hour timeframe clearly shows the continuation of the current bearish downtrend. Gold is strictly confined in a parallel descending channel trending downwards from historical price highs. The metal is consistently printing lower price highs as it trades under numerous descending black and red trendlines.
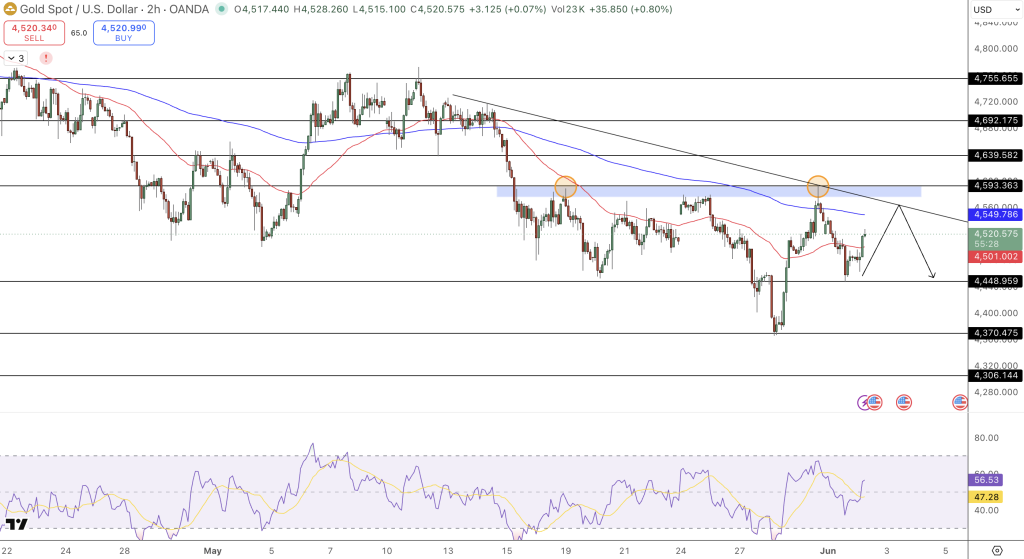
The pair is struggling to get past the range between $4,518 and $4,524, while the bears have recently managed to push the price below its local moving averages following several sell-offs around $4,578 to $4,584. Meanwhile, several lower wicks highlight that bulls are stepping in to defend the $4,518 support region, though the 14 period relative strength index has been stuck between 47 and 56 levels, indicating that momentum has flattened out but leaves plenty of room for gold to break down further.
- Resistance: $4,546, $4,549 to $4,578 (Trendline confluence), and major historical highs at $4,584.00.
- Support: $4,518, $4,500 (Psychological), and the main target of $4,461.00.
Trade Idea
A reactive trend-following setup is beginning to form as intraday price action gets squeezed towards the lower part of the current channel.
- Order: Sell Stop at $4,518.00 on the 2h candle close below.
- Targets: $4,500.00 (T1), $4,461.00 (T2).
- Stop: Above local consolidation at $4,546.00.
Conclusion
Our short-term outlook for the gold price suggests that the market is experiencing a structural squeeze that is testing the immediate technical support levels ahead of the week’s Federal Reserve event. Long-term factors including debt expansion in the West and the diversification of central bank reserves still mean that gold has a place in a macro portfolio over a period of several months, however intraday levels are being dictated by algorithmic momentum selling. Market participants should keep a close eye on volume levels near the edges of the current range and look for technical breakdowns to exit their positions until a bottom is found in the metal.
- Check out our free forex signals
- Follow the top economic events on FX Leaders economic calendar
- Trade better, discover more Forex Trading Strategies
- Open a FREE Trading Account
- Read our latest reviews on: Avatrade, Exness, HFM and XM
Related Articles


Sidebar rates
Related Posts
