Gold Price Daily Outlook: Will Intraday Channel Failures Drag Spot Gold Under $4,450?
Gold spot (XAU/USD) saw pronounced technical distribution Wednesday, declining 0.81% on the intraday to trade at 4,484.11 USD...
Quick overview
- Gold spot (XAU/USD) declined 0.81% to 4,484.11 USD, breaking through mid-term support zones amid tighter global monetary policy.
- Federal Reserve Chairman Kevin Warsh's tight macro policy and persistent inflation have diminished expectations for near-term rate cuts, impacting gold prices.
- China's central bank continues its 17-month streak of physical gold buying, providing structural support against bearish market trends.
- The ongoing ceasefire between the U.S. and Iran is reducing the safe-haven premium on gold, contributing to its recent price decline.
Gold spot (XAU/USD) saw pronounced technical distribution Wednesday, declining 0.81% on the intraday to trade at 4,484.11 USD. The safe-haven macro asset fell through mid-term support zones on the two-hour timeframe, with intense downward compression as tighter global macro monetary policy constraints are crushing the underlying fundamental central bank physical buy-side pressure.
Top Drivers
- The Warsh Macro Monetary Stance: Macro global asset allocations are reacting as Federal Reserve Chairman Kevin Warsh keeps his macro policy on the extremely tight side; April’s sticky inflation printing at 3.8% headline CPI and 4.1% core CPI has led institutional trading desks to remove all probability pricing of a near-term rate cut. This has pushed real rates into the higher range and kept gold prices on the floor.
- The 17 Month Institutional Buy Wall: Under the fundamental level, ongoing central bank physical demand has created the primary structural buy-side support preventing an extended macro bearish breakdown. China’s central bank People’s Bank of China has been on its 17th consecutive month of central bank physical metal buying, joining forces with other emerging market central banks to absorb the selling pressure from retail investors and futures speculator selling pressure.
- Ceasefire Gains Remove the War Premium: The nine-week-old conditional ceasefire between the United States and Iran remains active with steady forward progress on normalizing maritime transit of ships in the crucial strategic Strait of Hormuz narrow pass. The ongoing geopolitical stability is unwinding the extreme safe-haven buying premium that boosted gold prices at the start of the year.
Gold Chart: Technical Outlook
On the two-hour timeframe, the bearish trend continuation looks in perfect shape. XAU/USD stays nicely within a nicely formed parallel downward price channel, descending from its 4,760.00 USD price cycle swing high. We have printed a classic sequence of lower highs followed by lower lows.
In the 2H chart, the price has sliced down through a previous support level range at 4,518.00 to 4,536.00 USD as the price has failed multiple times to move past an overhead supply zone at 4,578.00 to 4,593.00 USD with a high volume of selling. Candlesticks have recently seen a number of long upper wicks, reflecting aggressive defense by the sellers in a short-term bearish trend.
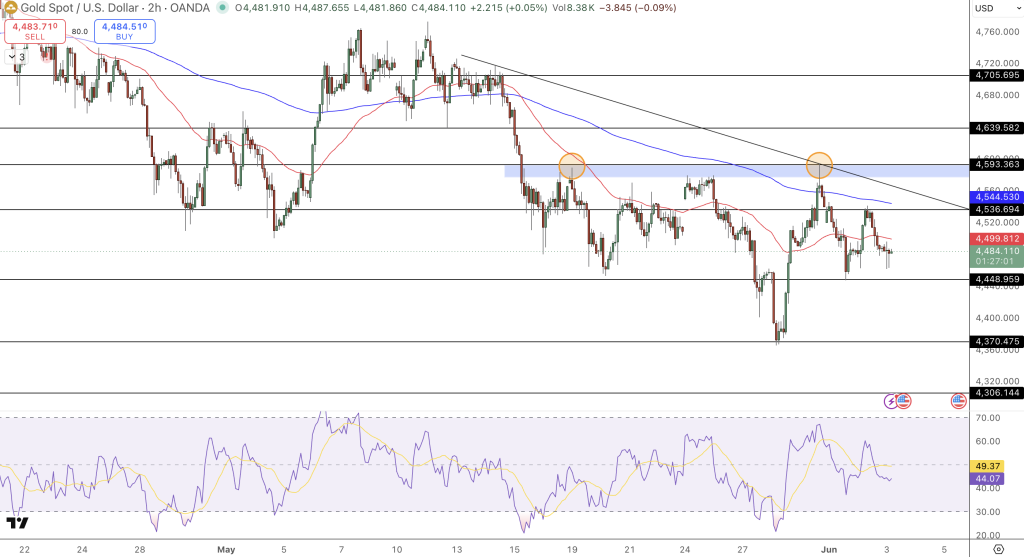
The 14-period relative strength indicator (RSI) sits near neutral-bearish levels at 44 with clear downside momentum. The RSI has not found any oversold readings yet, so there is much room left to fall before we reach the bottom of this technical pattern.
- Resistance 1.00: 4,518.00 USD, the most recent horizontal support turned resistance level.
- Resistance 2.00: 4,536.00 USD
- Resistance 3.00: 4,546.00 USD, multi-touch trendline support confluences.
- Support 1.00: 4,448.00 USD, a macro-level price target.
- Support 2.00: 4,400.00 USD, the next major psychological round number.
- Support 3.00: 4,370.00 USD, the macro-level technical trendline price target in this descending parallel channel.
Trade Idea
As this setup is a classic example of a trend continuation breakout, with momentum still favoring sellers, I will recommend taking trades short on a confirmed two-hour candle close.
- Type: Sell Stop
- Entry: Below 4,484.00 USD on a two-hour candle close.
- Take Profit 1: 4,448.00 USD
- Take Profit 2: 4,370.00 USD
- Stop Loss: Above 4,518.00 USD, the recently broken support zone.
Summary
Our short-term technical outlook on gold (XAU/USD) is bearish. A bearish trend regime shift has occurred as the technical momentum has taken immediate control of the price action below the major moving average. Over the medium to longer term, structural imbalances such as record highs in Western government debt levels and a diversification of central bank gold reserves are key bullish price drivers.
In the immediate timeframe, price trends will likely continue to follow automated momentum trading. Traders can closely watch to see if volume spikes on any price breakouts or sell-offs as they look to fade any potential short term counter-trend trades before the next major price cycle low is confirmed.
- Check out our free forex signals
- Follow the top economic events on FX Leaders economic calendar
- Trade better, discover more Forex Trading Strategies
- Open a FREE Trading Account
- Read our latest reviews on: Avatrade, Exness, HFM and XM
Related Articles


Sidebar rates
Related Posts
Ava

