Microsoft Stock (MSFT) Bounces Bullishly — More Upside Ahead?

Quick overview
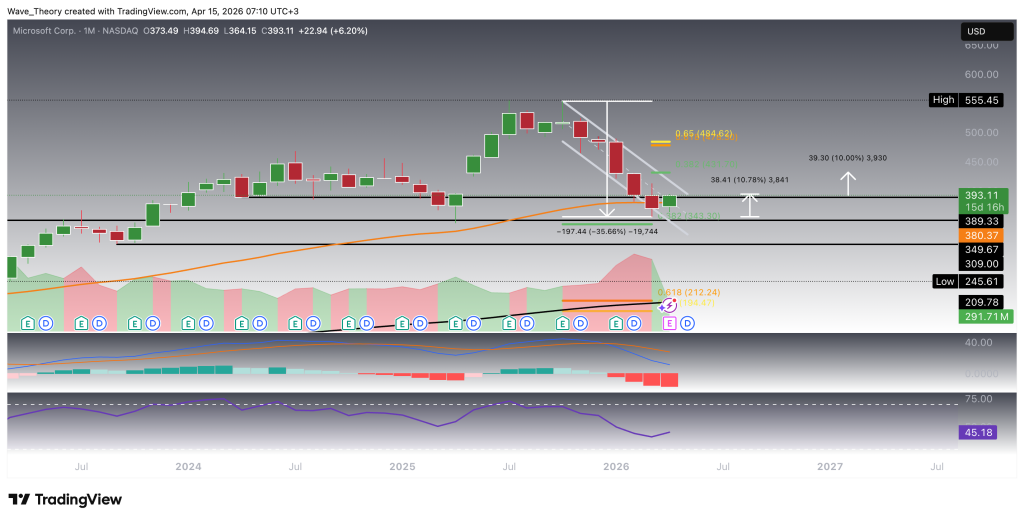
- Microsoft (MSFT) has shown signs of a bullish rebound after a six-month corrective phase, with recent price action indicating potential upward momentum.
- The stock has bounced off significant support levels between $350 and $389, advancing approximately 11% this month and breaking above the 50-month EMA at $380.
- Key resistance levels to watch include the 50-day EMA at $398 and the 0.382 Fibonacci resistance at $432, which will determine the sustainability of the current recovery.
- A decisive breakout above $484 would signal the end of the corrective phase and open the path toward retesting all-time highs around $555.5.
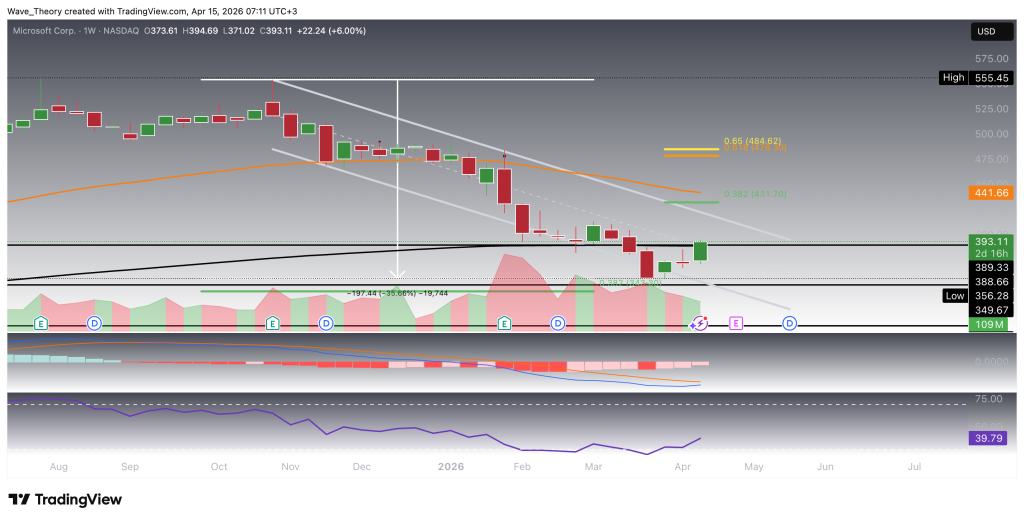
More Bullish Signals on Microsoft Stock Weekly Chart
On the weekly timeframe, Microsoft (MSFT) presents a predominantly bullish technical backdrop despite still trading within a broader downward channel. Momentum is notably improving, as the MACD histogram has been ticking consistently higher over the past three weeks, indicating a gradual buildup in bullish momentum. In line with this, the MACD lines are approaching a potential bullish crossover, which would further reinforce the case for continued upside.
At the same time, the RSI remains in neutral territory, suggesting that the stock is neither overbought nor oversold and retains room for further directional expansion. Importantly, the EMA structure continues to display a golden crossover on the weekly chart, confirming that the mid-term trend remains bullishly intact despite the recent corrective phase.
Given this setup, Microsoft appears positioned to extend its current recovery move, with the next key upside targets located at the 0.382 Fibonacci resistance around $432 and the 50-week EMA near $442. These levels represent critical resistance zones that will determine whether the stock can transition from a corrective rebound into a more sustained bullish continuation.
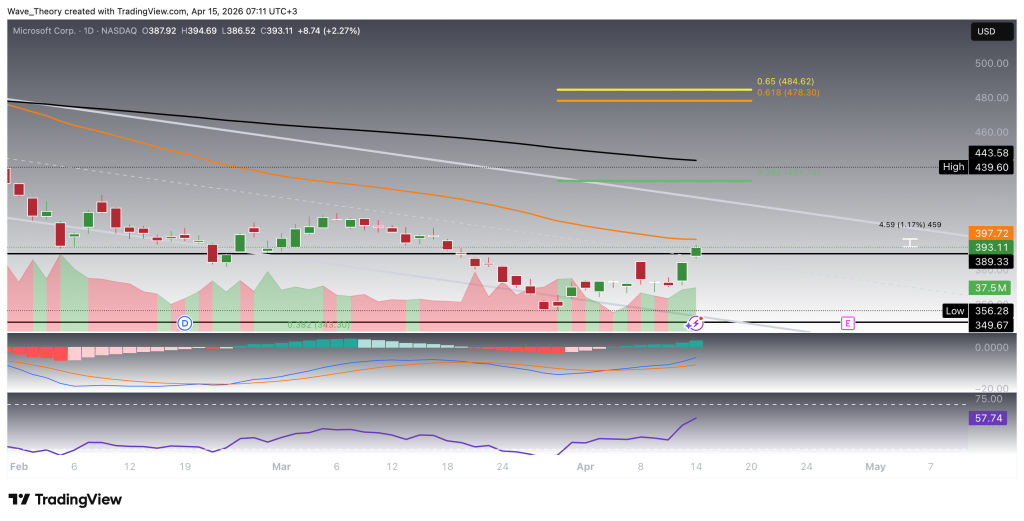
Microsoft Stock Approaches Critical Resistance
On the daily timeframe, Microsoft (MSFT) is approaching a key resistance level at the 50-day EMA around $398, marking a near-term inflection point for price action. A confirmed bullish breakout above this level could pave the way for a continuation toward the 0.382 Fibonacci resistance at approximately $432, reinforcing the ongoing recovery attempt.
That said, the indicator landscape remains mixed. The EMA structure continues to display a death cross, which confirms a bearish trend in the short- to medium-term horizon. In contrast, momentum indicators are turning constructive: the MACD lines are bullishly crossed, and the MACD histogram is trending higher, signaling strengthening upside momentum. Meanwhile, the RSI remains in neutral territory, indicating no immediate overbought pressure and leaving room for further upside expansion.
Should Microsoft successfully break through the immediate resistance levels, the 200-day EMA near $444 emerges as the next significant barrier, acting as additional dynamic resistance and a key level to watch for confirming a broader trend reversal.
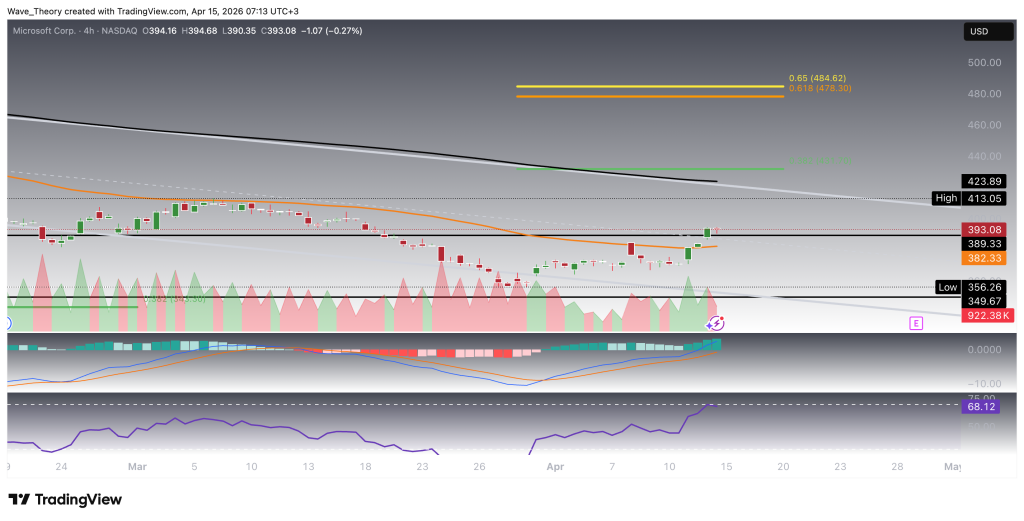
More Mixed Signals on the 4H Chart
On the 4-hour timeframe, Microsoft (MSFT) continues to present a mixed technical structure, with momentum and trend indicators diverging. On the bullish side, the MACD lines are crossed to the upside, and the MACD histogram is trending higher, indicating strengthening short-term momentum. In parallel, the RSI is approaching overbought territory, suggesting that the current move is extended in the near term and may face temporary exhaustion.
However, this constructive momentum is counterbalanced by the EMA structure, which still displays a death cross, confirming that the short-term trend remains bearish despite the recent recovery. This divergence highlights a market in transition, where bullish momentum is building within a still-negative trend framework.
From a price action perspective, Microsoft has already achieved a technically significant breakout above the 50-period EMA on the 4H chart at approximately $382, reinforcing the current upward trajectory. Should this move continue, the next key resistance levels are located at the 200-period EMA around $424 and the 0.382 Fibonacci resistance near $432. These zones represent critical barriers where the rally could either stall or transition into a more sustained bullish continuation if decisively broken.
Microsoft at a Pivotal Turning Point – Key Levels in Focus
Microsoft (MSFT) continues to trade within a broader bullish framework but remains in the aftermath of a multi-month correction, now attempting to re-establish upside momentum after bouncing from a key support region. While higher timeframe signals, including sustained EMA golden crossovers, reinforce the long-term bullish structure, lower timeframe dynamics—such as persistent death crosses—highlight that the recovery is still in its early stages.
Key support levels:
$350–$389 – Primary demand zone
$343 – 0.382 Fibonacci support
$380 – 50-month EMA (major dynamic support)
Key resistance levels:
$398 – 50-day EMA (near-term barrier)
$424 – 200-4H EMA
$432 – 0.382 Fibonacci resistance
$442–$444 – Confluence of 50-week EMA and 200-day EMA
$484 – Golden Ratio (critical breakout threshold)
$555.5 – Previous all-time high
Scenario:
As long as MSFT holds above the broader $350–$389 support region, the current rebound remains technically valid, with upside potential toward $432 and the $442–$444 resistance cluster.
A decisive break above $484 would mark a structural shift, effectively ending the corrective phase and reopening the path toward the $555.5 highs. On the downside, failure to maintain current levels would increase the likelihood of a pullback toward $343 or deeper into the established support zone.
Bottom line:
Microsoft is approaching a decisive juncture, where strengthening momentum is beginning to challenge a still-fragile recovery structure. The interaction with resistance at $398 and subsequent behavior around $432–$444 and $484 will be critical in determining whether the stock transitions into a sustained uptrend or remains range-bound within its corrective phase.
- Check out our free forex signals
- Follow the top economic events on FX Leaders economic calendar
- Trade better, discover more Forex Trading Strategies
- Open a FREE Trading Account
- Read our latest reviews on: Avatrade, Exness, HFM and XM
Related Articles
Sidebar rates
Related Posts
