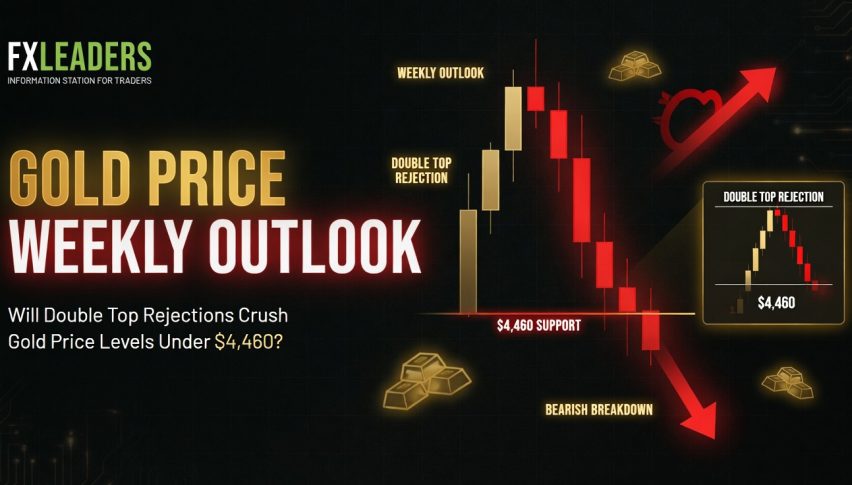
Gold Price Weekly Outlook: Will Double Top Rejections Crush Gold Price Levels Under $4,460?
Gold spot (XAU/USD) faces technical trouble as a prominent double top forms near $4,590. Read our weekly price forecast, key macro drivers..
Quick overview
- Gold spot price ended the week at $4,540.53, showing minimal change as it remains in a multi-week consolidation range.
- The recent hawkish stance from banking elites and persistent inflation data are limiting gold's upward potential.
- Geopolitical tensions have eased with a stable US-Iran ceasefire, reducing the demand for gold as a safe haven.
- Technical analysis indicates a bearish outlook for gold, with a potential breakdown expected in the coming week.
Gold spot continues to move within an extremely delicate structural framework, ending the week at $4,540.53 with almost zero change (0.04% flat). The metal is currently trapped inside a fierce, multi-week consolidation range, challenging the key psychological points of its overall structural pattern, while a more aggressive hawkish turn from mainstream banking elites steadily eats away at speculative liquidity.
Gold Fundamental Analysis
The Warsh Macro Paradigm: Global money rotation numbers are continuing to play out under a highly restricted landscape following the official inauguration of new Federal Reserve Chairman Kevin Warsh. In tandem, the hot April 3.8% headline CPI continues to show signs of underlying stickiness, eliminating any remaining near-term hopes for interest rate cuts, and consequently supporting stronger real interest rates to continue acting as a ceiling against the gold price.
Ceasefire momentum stalls safe haven flows: The US-Iran ceasefire is currently holding strong for eight weeks, and commercial shipping activity through the strategically vital Hormuz Strait is continuing to recover toward 75 to 80% of its pre-crisis levels, effectively neutralizing the immediate geopolitical crisis premium that drove gold earlier this year.
17-Month structural demand floor: Global banking elites continue to play a key role in structurally supporting the spot price. The People’s Bank of China has been purchasing gold in a steady fashion for the past 17-plus months, supported by secondary emerging markets, absorbing the heavy selling in retail and futures.
Gold (XAU/USD) Technical Outlook
Spot gold’s two-hour and four-hour time frame charts display a very clear and prominent bearish chart pattern. The spot price has just formed a classic double top configuration on the back of significant selling activity in the $4,584 to $4,590 area. The price action subsequently sold off decisively against its prevailing black trendline, breaking down below the key short-term intraday levels.
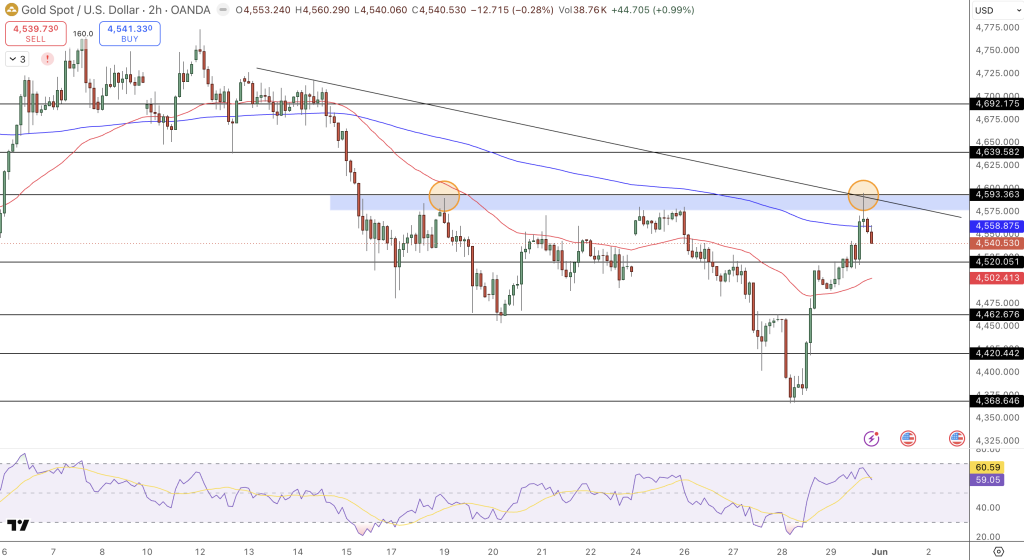
Since the end of weekend trading, spot prices are moving in a narrow, tight sideways movement around the $4,540 level, remaining within the confines of a broader, bearish pattern descending from the $4,719 monthly top.
The RSI14 indicator is relatively neutral at the 59 level, with a weakly bearish bias, meaning that spot gold has further downside runway for Monday.
Resistance levels: $4,558, $4,578 (trendline confluence), and the significant previous double top at $4,590.
Support levels: $4,518 (immediate trendline breakout level), $4,502, and the primary lower target at $4,462.
Trade Strategy
We anticipate that spot gold will break out of its sideways range on the weekend to continue the breakdown.
- Sell Stop entry below a confirmed two-hour candlestick close at $4,518.
- Take profits at: $4,462 (T1) and $4,368 (T2).
- Stop loss placed just above the immediate local consolidation at $4,558.
Wrap Up
Our latest outlook for gold price continues to favor a key bearish breakout in the coming week. While the overarching macro thesis of increased Western bond debt and central bank reserve diversification remains intact in the longer term, spot prices continue to remain under technical control from immediate trend-based downside momentum.
Traders should watch carefully for any pre-market opening gaps or large-scale volatility at the lower trendline boundary of the double top pattern. We will treat any minor short-term counter-trend bounces as shorting opportunities until the breakdown in price is confirmed.
- Check out our free forex signals
- Follow the top economic events on FX Leaders economic calendar
- Trade better, discover more Forex Trading Strategies
- Open a FREE Trading Account
- Read our latest reviews on: Avatrade, Exness, HFM and XM

Related Articles



Sidebar rates

Related Posts
 Save
Save