WTI Crude Oil Analysis: $85 as Ceasefire Collapse Reverses MOU Gains; Supply Fear vs. Demand Destruction
WTI at $85 after 16% surge on ceasefire collapse. Iran sovereignty claim over Hormuz, EIA demand cut, and $87.95 breakout target explained.

Quick overview
- WTI oil prices surged 16% to $85.45 following the collapse of a ceasefire between the U.S. and Iran, driven by geopolitical tensions.
- Iran's claim of sovereignty over the Strait of Hormuz remains a key sticking point, complicating efforts for a sustainable ceasefire.
- The EIA projects a decline in global oil consumption by 1.2 million barrels per day by 2026 due to high prices, indicating potential demand destruction.
- Technical analysis suggests that WTI could break out above $87.95, with support at $83.45, while inventory trends will be crucial for future price movements.
WTI at $85 after 16% surge on ceasefire collapse. Iran sovereignty claim over Hormuz, EIA demand cut, and $87.95 breakout target explained. As of July 22, WTI oil is pricing at $85.45, sitting near its highest point since the start of the spring. Following the implosion of last week’s truce, the price of crude increased 16%, taking its rally off $68, near the MOU lows.
The June 18th interim agreement had pushed the oil price nearly all the way back to pre-war levels before it fell apart. A specific sticking point that has not been settled and therefore blocks a sustainable ceasefire is a claim by Iran that it has sovereignty over the Strait of Hormuz and demands the right to levy tolls on transit commercial vessels.
The EIA sees global consumption falling 1.2 million barrels per day in 2026, due to demand destruction from sustained $100+ pricing. Supply-side fear and demand-side reality are working in two very distinct directions from each other.
How WTI Got Here: The Full Picture the Source Document Misses
Following the June 18th U.S.-Iran MOU, WTI cratered toward $68, essentially canceling out all the price increases of the war in the process, as traffic moved through the Strait began recovering. At 6/26, WTI finished at $69.23, the last close at less than $70. The price of the war started on February 27, the day before the war began.
Then the truce fell apart. WTI spiked almost 16% last week, closing at $82.49, with the spike largely driven by the increased geopolitical fears triggered by the collapse of the truce between the U.S. and Iran.
The unresolved point in particular is that Iran says the Strait of Hormuz is under its control and the U.S. says this waterway must be available for free commerce. That is not the difference of an engineer, that is the difference of the state of sovereignty and cannot be worked out unless the state of power backs down.
The other side of the coin is the demand side. The EIA says world oil consumption will decline 1.2 million barrels per day on average in 2026, with 0.8 million barrels of that coming from non-OECD nations, which the demand destruction will come about as a direct effect of the oil price staying high for an extended period of time.
In addition, OPEC has also reduced its 2026 global oil demand growth forecast for the third consecutive month. The market is being driven entirely by supply fears, not improving demand.
The inventory data of API and EIA this week. A few days ago, the EIA report showed oil inventories down 3.9 million barrels, gasoline down 3.4 million barrels, both good for WTI, and distillates added 4.2 million barrels. Should this week show the same trend with further drawdowns, it would confirm to WTI that the fundamental tightness of supplies remains real
WTI Technical Analysis: $83.45 Support, $87.95 Is the Breakout Gate
As of this writing, WTI is trading at $85.45. In the 4 hour chart, WTI is in a higher uptrend channel formed at the July lows. This price is above both the 50 period EMA (currently at $79.79) and the 100 period EMA (now $79.21). The 61.8% Fibonacci retracement at $83.45 is the immediate support after the recent breakout.
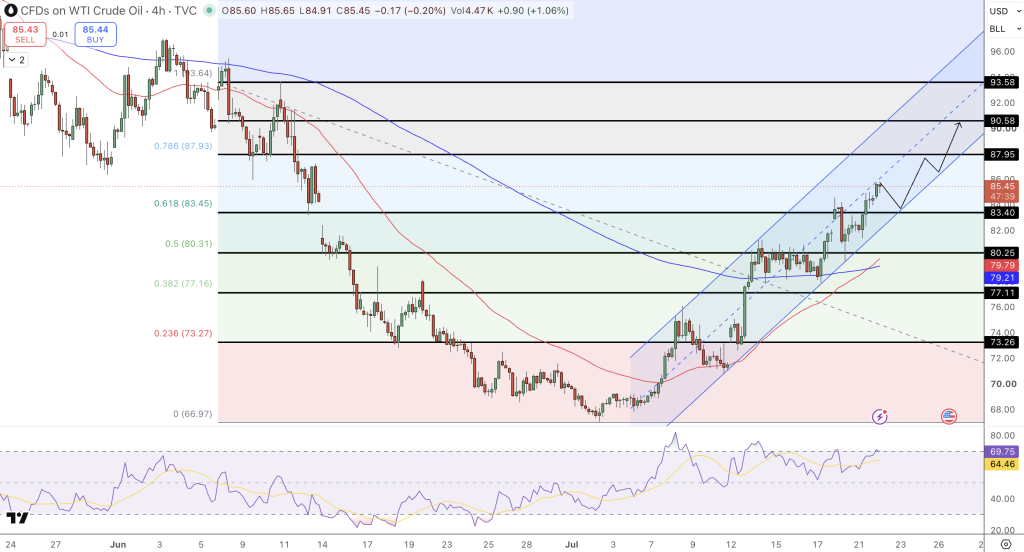
Resistance: $87.95 (78.6% Fib) to $90.58 to $93.58 (full Fib channel extension). Support: $83.45 (61.8% Fib) to $80.25 to $79.21 (100 EMA).
RSI is just at 70, indicating bullish sentiment but is approaching overbought. Consistent with a momentum breakout following a geopolitical shock, where overbought readings can persist.
Longs $85.45 | $87.95 to $90.58 | Stop $83.45.
Event of the week: EIA report on Wednesday. Anything higher than 4 million barrels would support WTI and likely force the price to breach the $87.95 resistance level. A build would signal demand destruction is materialising faster than the geopolitical risk premium warrants and risks a pullback toward $83.45.
FAQ: WTI — Sovereignty Dispute, 16% Surge, and the Demand Destruction Risk
Why did WTI surge 16% last week after the MOU had nearly normalised oil prices?
The ceasefire fell apart because Iran and the US were unable to resolve basic disagreements about sovereignty of the Strait of Hormuz, which Iran would like it to be treated as a paid toll lane whereas the US says free commercial transit for all vessels needs to be preserved. It’s not a communication gap, it’s a fundamental disagreement.
The market quickly lowered the odds for getting a successful, workable Hormuz agreement, thus returning to life a war risk premium that was almost gone from 6/18 to 6/26.
What is demand destruction and how does it affect WTI’s ceiling?
EIA predicts global demand will fall 1.2mbpd in 2026, as the high price of oil will cause a reduction in consumption, especially in non-OECD countries. This demand destruction provides a price ceiling to oil, as at a sufficiently high price, demand will be destroyed to the point where no supply side resolution is needed.
Already, Asian refiners are starting to look at other options, as $85 oil is high enough to justify doing some supply diversion, but $100 oil is definitely high enough to cause permanent change in demand patterns in favor of substitution and conservation. Thus OPEC just slashed its own demand growth projection for 3 straight months, in spite of the disruption in supply.
What is the WTI price target if $87.95 breaks?
A confirmed breakout at $87.95 would likely push WTI towards $90.58 and then $93.58, as the measured channel would be completed. For the bullish thesis to play out, there must be a draw in inventories this week at the EIA’s report, Hormuz will continue to be impassable for commerce, and the July 28 to 29 FOMC will keep rates unchanged without the addition of hawkish commentary.
The bearish scenario is Iran and US finding some sort of compromise on Hormuz, leading to the re-instatement of free access to it for commerce, which would bring WTI back down to $68 to 72, leaving last week’s 16% almost entirely unwound.
- Check out our free forex signals
- Follow the top economic events on FX Leaders economic calendar
- Trade better, discover more Forex Trading Strategies
- Open a FREE Trading Account
- Read our latest reviews on: Avatrade, Exness, HFM and XM

Related Articles


Sidebar rates

Related Posts
 Save
Save