Forex News and Market Analysis
Sunday, August 2, 2026

The arrival of a new trading week has employees at Microsoft (NASDAQ: MSFT) reflecting on one of the ...
3 hours

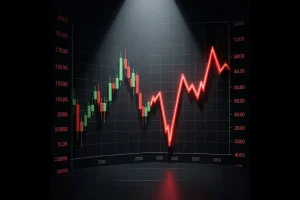
Intel (NASDAQ: INTC) has entered a sharp correction after rallying more than 700% from its 2025 low ...
10 hours
Ripple Bullish forecast: XRP Joins Bitcoin, Ethereum with Crystal-Clear US Regulatory Green Light
1 min read

XRP is currently consolidating around the $1.00 psychological threshold, ba ...
11 hours
Dow Jones Industrial Average E-mini Futures traded higher ...
12 hours

...
1 day
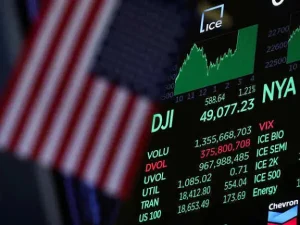
Dow Jones E-mini Futures settled at ...
1 day

XRP is hovering aro ...
1 day

(XAU/USD) is trading near $4,020–$4,045/oz, consolidating after pulling bac ...
1 day

AngloGold Ashanti delivered sharply higher second-quarter earnings and cash flow, but the JSE-listed ...
2 days
Intel Stock Ends Week at $90 after Failing to Retake $100, Despite Improving Profitability
3 min read

Intel stock briefly regained momentum after stronger Microsoft Azure growth revived confidence in se ...
2 days

Roblox stock's latest collapse highlights how quickly investor sentiment can deteriorate when slowin ...
2 days
The Dow Jones and Nasdaq are rebounding sharply after Wednesday's selloff, with technology stocks le ...
2 days

...
2 days


Nvidia shares recovered as ARK Invest accumulated the stock and strong clo ...
2 days

Micron shares rallied 18% and gained another 5% overnight as Samsung’s sho ...
2 days
Silver Surges Past $59 as Weak Dollar, Soft GDP and Middle East Tensions Fuel XAG/USD Rally
1 min read

...
2 days

On July 31st, Gold fell 0.5% trading at $4,076.53, reaching a 144 ye ...
2 days
Nasdaq 100 Rockets to 28,500 as Microsoft Cloud Growth, AMD/ASML/AMAT Demand Ignite Rally
1 min read
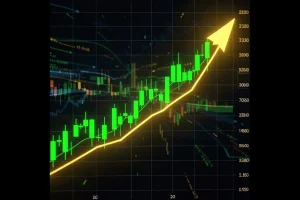
Na ...
2 days
When it comes to the markets, staying abreast of important economic events and breaking news
items is a full time job. Whether one is an active day trader or a long-term investor, the need to be current is one that must be satisfied every
single day. The FX Leaders news feed is a great way to stay on top of the evolving global
marketplace.
Everything You Need In An FX News Service
All Things Forex News, 24 Hours A Day, 5 Days A Week
Sidebar rates
Ava

