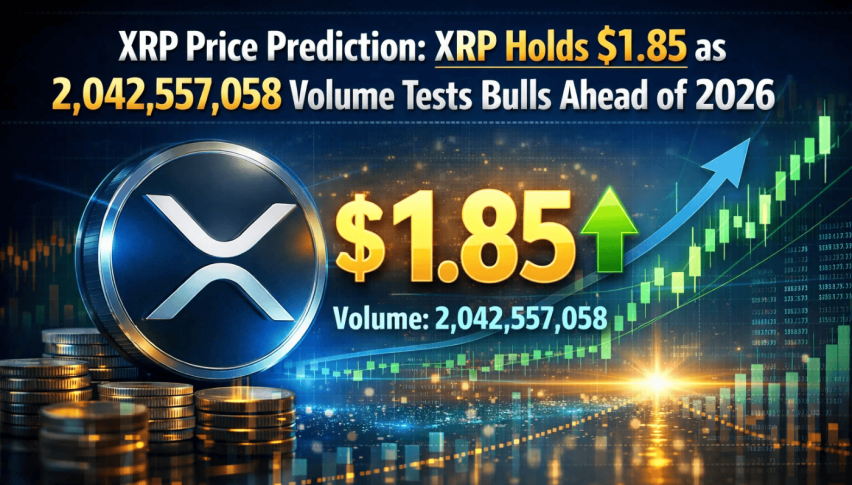
XRP Price Prediction: XRP Holds $1.85 as 2,042,557,058 Volume Tests Bulls Ahead of 2026
XRP begins the New Year trading near $1.85, with global markets easing into January after thin holiday liquidity. According to live data...
Quick overview
- XRP is trading near $1.85 with a 24-hour trading volume of over $2 billion and a market cap of $112.2 billion.
- The price action indicates consolidation, with traders assessing market conditions after a December selloff.
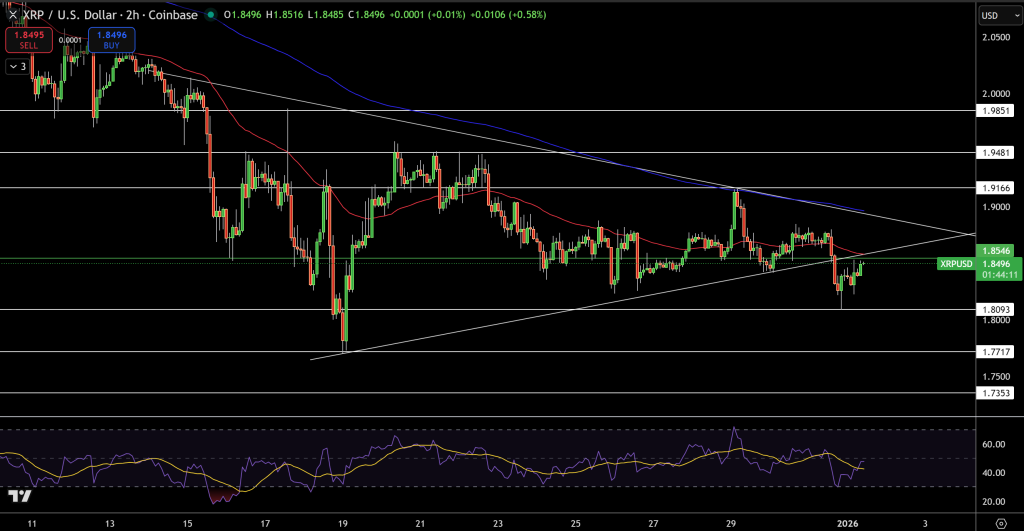
- XRP is currently in a symmetrical triangle pattern, with resistance near $1.92–$1.95 and support at $1.80–$1.82.
- A breakout above $1.92 could target $2.00, while a drop below $1.80 may lead to a deeper pullback.
XRP begins the New Year trading near $1.85, with global markets easing into January after thin holiday liquidity. According to live data, XRP’s 24-hour trading volume stands at $2,042,557,058, while its market capitalization remains firm at $112.2 bn, ranking it fifth among all cryptocurrencies.
Price action reflects consolidation rather than panic. After a sharp December selloff, XRP has shifted into a wait-and-see phase as traders return from year-end positioning and assess whether early-2026 flows can reset momentum.
With 60.67 bn XRP in circulation out of a 100 bn maximum supply, XRP remains one of the most liquid large-cap crypto assets, making short-term technical signals especially relevant as the year opens.
Symmetrical Triangle Signals Compression
On the 2-hour chart, XRP is trading inside a symmetrical triangle, defined by a descending trendline from the $2.05 high and a rising support line from the $1.78 low. This pattern typically reflects tightening volatility rather than trend exhaustion.
Repeated candlestick rejections near $1.92–$1.95 show sellers defending that zone aggressively. This area aligns with the 38.2% Fibonacci retracement of the December decline and the falling 200-period EMA, which continues to act as dynamic resistance.
Key technical observations include:
- Triangle resistance clustered near $1.92–$1.95
- Structural support holding at $1.80–$1.82
- Apex nearing, increasing breakout probability
Momentum Remains Soft but Stable
Short-term momentum remains muted. The 50-period EMA is flat near $1.86, signaling balance rather than trend strength. Meanwhile, the RSI near 45 suggests weak momentum without oversold conditions, leaving room for expansion in either direction once volume returns post-holiday.
This setup places XRP at a technical inflection point as liquidity normalizes in early January.
XRP/USD Outlook – What Traders Are Watching Next
As markets fully reopen after the New Year break, direction will likely be dictated by a decisive break from the triangle:
- A move above $1.92 would expose $2.00
- A breakdown below $1.80 risks a deeper pullback
Trade idea: Buy on a confirmed break above $1.92, target $2.00, stop below $1.84.
- Check out our free forex signals
- Follow the top economic events on FX Leaders economic calendar
- Trade better, discover more Forex Trading Strategies
- Open a FREE Trading Account
- Read our latest reviews on: Avatrade, Exness, HFM and XM
Related Articles


Sidebar rates
Related Posts
