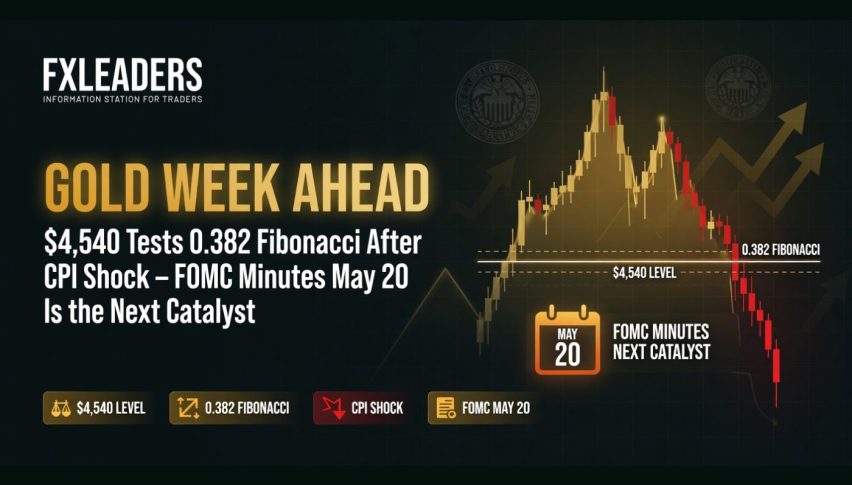
Gold Week Ahead: $4,540 Tests 0.382 Fibonacci After CPI Shock – FOMC Minutes May 20 Is the Next Catalyst
On May 16, XAU/USD sits at $4,540, down 2.40% and on track for a 4% loss this week after April CPI spiked to 3.8% YoY, its highest level...
Quick overview
- XAU/USD is currently at $4,540, down 2.40%, and facing a potential 4% weekly loss due to rising CPI and PPI figures.
- The likelihood of a Fed rate cut has dropped to near 0%, with a 50% chance of a rate hike in December now priced in.
- Physical gold demand remains strong despite price declines, with Q1 2026 demand reaching a record $193 billion.
- Gold's future trajectory is uncertain, hinging on key technical levels and upcoming economic data releases.
On May 16, XAU/USD sits at $4,540, down 2.40% and on track for a 4% loss this week after April CPI spiked to 3.8% YoY, its highest level since May 2023, and PPI recorded its largest monthly gain since early 2022. This shift has pushed CME FedWatch odds from a 48% chance of a June cut down to near 0% chance of any Fed cut in 2026, with now 50% chance of rate hike in December now priced in. Gold now sits 18.3% below its all-time high of $5,589.
Gold is either about to recover, or it’s about to go even deeper, and two lines are what separates the two: the 0.382 Fibonacci at $4,540, and the rising trendline (which began in February).
What Happened to Gold in the Past Week
April CPI came in at 3.8% year-over-year versus a 3.7% expectation, hitting its highest point since May 2023. Meanwhile, PPI just recorded its single biggest increase since early 2022. Consequently, CME FedWatch now sees a near-zero chance of a Fed cut in 2026. Meanwhile, traders are pricing a 50% chance of a rate hike in December.
The chain reaction is pretty clear-cut: High CPI → increased likelihood of rate hike → real yields climb → USD strength → gold’s primary fundamental pillar erodes. Markets have fully ruled out a Fed rate cut this year, with some traders increasingly pricing in a hike by December. The appointment of Fed Chair, who replaces Powell, is just another piece of evidence on rate hike likelihood, given that the Senate confirmed Fed Chair Kevin Warsh and the hawkish former official is known for his inflation-fighting attitude (see dissents from 2010–2011).
There’s one detail the sell-off misses: Physical gold buyers came into this sell-off. In Q1 2026, total gold demand was 1,231 tonnes valued at a record $193 billion; demand for bar and coin was up 42%. That demand pattern has carried over through the sell-off in May. Gold prices are down and buyers don’t shy away, they buy more. That’s not characteristic of distribution. Energy prices are up 17.9% YoY. Real average hourly wages are now negative, for the first time since April 2023. In this environment, falling real wages, above-target inflation, elevated oil, the argument for holding physical gold over financial assets is pretty self-explanatory.
XAU/USD Technical Analysis: Channel Support Is the Last Stand
On the daily, gold sits at $4,540. It’s testing the 0.382 level and its rising trendline coming from the February low of $4,107. RSI is between 39 and 45, in oversold territory, with positive divergence that has, in the past, signaled bearish pressure waning at channel support.
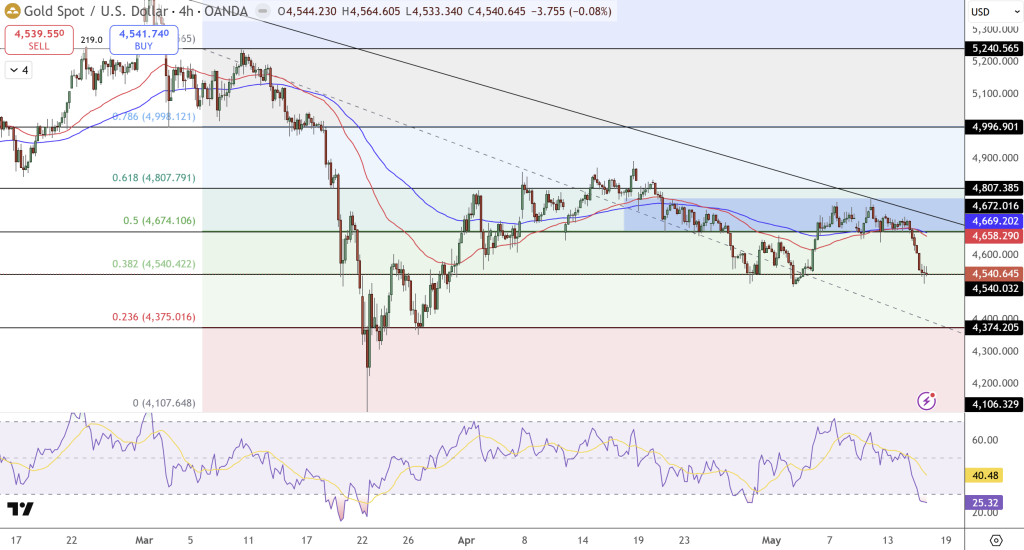
- Resistance: $4,560 (immediate resistance) → $4,674 to $4,807 (red MAs / resistance zone).
- Support: $4,502 → $4,375 (lower Fibonacci support) → $4,107 (support from Feb. channel / bottom of range).
If all goes according to plan, XAU/USD could keep falling through May 18 before finding a floor. The next major event will be the FOMC minutes on May 20, 4 policymakers at the last Fed meeting dissented, highlighting the widening divide among the Fed’s policymakers amid the war in Iran.
Position: Long on break above $4,560 | Targets $4,674 to $4,807 | Stop loss below $4,502.
Watchlist: FOMC minutes (May 20), PMI data (May 21), UoM inflation expectations (May 22).
FAQ: Gold, CPI shock, risk of rate hikes, and the path to $5,000
Gold shouldn’t benefit from 3.8% CPI, so why is it falling? For the most part, in the short run, gold correlates to the dollar and real interest rates rather than to price increases themselves. Hot CPI data killed the rate-cut bets and increased the likelihood of rate hikes this December (which has increased USD strength and higher real yields).
Higher real rates and USD strength are both headwinds for non-dividend-generating gold. It’s worth noting that gold remains a long-term inflation hedge, this is a short-term rate-induced headwind at the moment.
In the past, this divergence is typically solved in gold’s favour as soon as USD strength wanes, but we’ll likely need a peace agreement or something softer than current oil prices.
What does Kevin Warsh taking the helm mean for gold long-term?
Looking at every tightening cycle since 1971, gold typically peaks in bull markets between six to 18 months after the final Fed hike, when real yields turn negative (on an inflation-adjusted basis). Warsh’s hawkish stance may extend the rate-hold or hike cycle, which is a near-term gold headwind.
But his eventual pivot, when it comes, would coincide with the conditions that historically produce gold’s strongest sustained rallies.
What do we have on deck for XAU/USD this week, May 18 to 22? The FOMC minutes on May 20 are the headline act, 4 Fed policymakers dissented at the last FOMC meeting, highlighting a genuine split in opinion. Also on tap: PMI (May 21) and University of Michigan inflation expectations (May 22).
The LBMA consensus for 2026 is $4,741.97, gold’s at $4,540 right now, so it’s trading below the average. Gold’s average forecast for Q4 2026 (at least, according to JP Morgan) is $5,055. At the 0.382 level, $4,540 now, gold could either keep rising or fall even more.
- Check out our free forex signals
- Follow the top economic events on FX Leaders economic calendar
- Trade better, discover more Forex Trading Strategies
- Open a FREE Trading Account
- Read our latest reviews on: Avatrade, Exness, HFM and XM
Related Articles

Sidebar rates
Related Posts
