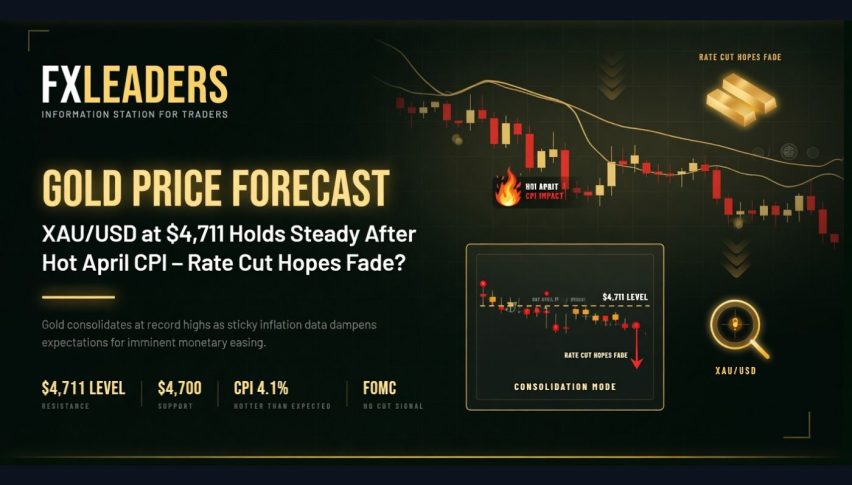
Gold Price Forecast: XAU/USD at $4,711 Holds Steady After Hot April CPI – Rate Cut Hopes Fade?
As of morning trading on May 13, 2026, gold spot prices (XAU/USD) are trading around $4,711.60/oz, up 0.26% for the day but currently...
Quick overview
- Gold spot prices are currently trading at $4,711.60/oz, up 0.26% for the day, following stronger-than-expected U.S. inflation data.
- April CPI numbers showed a headline inflation increase of 0.6% MoM and 3.8% YoY, the highest annual pace since May 2023.
- Central banks, particularly China, have been net buyers of gold for 17 consecutive months, contributing to bullish market sentiment.
- Technical analysis indicates a bullish price structure for gold, with key resistance levels at $4,724 and $4,762.
As of morning trading on May 13, 2026, gold spot prices (XAU/USD) are trading around $4,711.60/oz, up 0.26% for the day but currently moving in a tight consolidation range after the U.S. inflation data came out stronger than expected.
Today’s main catalysts:
- Hot April CPI numbers: Headline inflation was +0.6% MoM and +3.8% YoY, above expectations. The annual pace of headline inflation (3.8%) was the highest since May 2023, and core CPI also came out hotter than expected at +0.4% MoM and +2.8% YoY. Higher prices for shelter and lingering price pressures from the earlier spike in energy prices were the main contributors to the hotter than expected headline and core CPI. As inflation has held up better than expected, markets are now less hopeful about rate cuts from the Fed.
- Continued Official-Sector Buying: Central banks have been net buyers of gold for 17 straight months. China’s central bank has added to its gold reserves for 17 consecutive months now.
- Geopolitics + macro data: The conditional U.S.-Iran ceasefire continues to hold with partial Strait of Hormuz normalization, reducing acute safe-haven demand. The combination of this geopolitical risk de-escalation and hotter inflation data have been driving a modest strength in the dollar and U.S. treasury yields for much of the session.
- What the higher CPI means for Fed policy: In light of the strong CPI, many analysts believe the overall disinflation trend remains intact, especially in light of the softer-than-expected jobs report from last week.
Gold (XAU/USD) Technical Analysis:
Gold has printed a bullish hammer candlestick pattern on the 2-hour timeframe after testing the ascending uptrendline support that was formed from the early-May lows around $4,508/oz. The price is currently trading above the dynamic blue moving average support between $4,695/oz and $4,711/oz, while still respecting the midline trend of the rising trading channel.
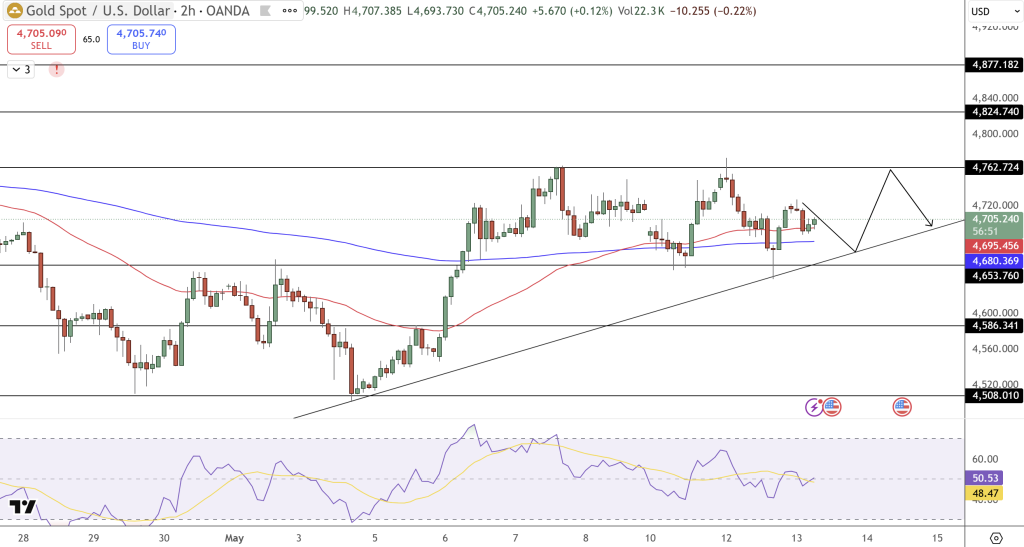
The current bullish price structure still has intact higher lows after breaking above the 0.236 Fibonacci extension. The current impulse leg has been defended well at the channel boundary. The RSI (14) indicator has also been hovering neutral around 48 to 52, while still showing positive momentum divergence after the recent dip. The next major price resistance sits at $4,724, and the next major price resistance sits at $4,762 to $4,824.
Key Support/Resistance Levels to Note:
- Resistance: $4,724; $4,762; $4,824
- Support: $4,695; $4,675
Trade Idea for Gold (XAU/USD):
Enter a long (buy) position on gold if prices push above $4,720. Set a target of $4,762 to $4,824, and a stop-loss just below $4,695. While gold is currently trading in a narrow range following last week’s softer jobs report and stronger-than-expected CPI data, the long-term trend outlook remains constructive as central banks continue to purchase gold for their own strategic reserves as a means of inflation hedging, and also to diversify their foreign exchange reserves away from the dollar.
- Check out our free forex signals
- Follow the top economic events on FX Leaders economic calendar
- Trade better, discover more Forex Trading Strategies
- Open a FREE Trading Account
- Read our latest reviews on: Avatrade, Exness, HFM and XM
Related Articles


Sidebar rates
Related Posts
