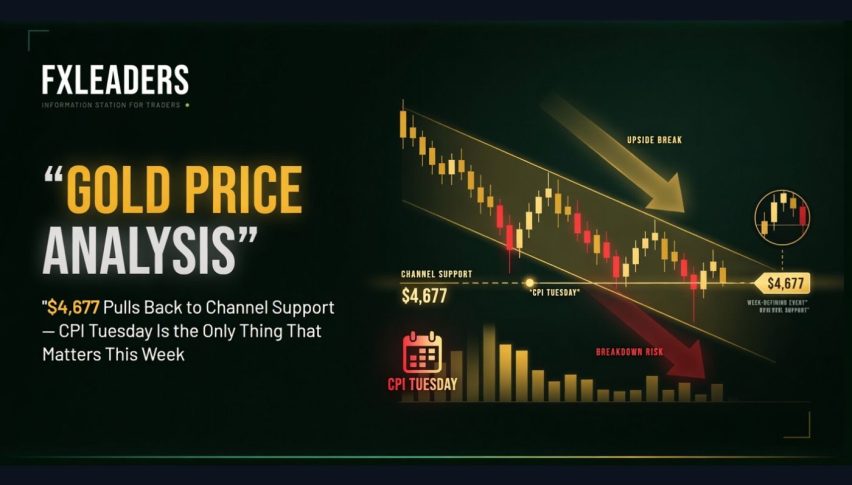
Gold Price Analysis: $4,677 Pulls Back to Channel Support — CPI Tuesday Is the Only Thing That Matters This Week
Gold is trading at $4,677 on May 11, pulling back from last weeks high of $4,765 - a level the price shook off with only a day to go...
Quick overview
- Gold is currently trading at $4,677, having pulled back from last week's high of $4,765 ahead of the upcoming CPI figures.
- Last week, gold gained 3.72% due to falling oil prices, softer bond yields, and easing inflation fears, but this could reverse if CPI numbers exceed expectations.
- Recent geopolitical tensions involving Iran and U.S. military discussions have added pressure on gold prices, leading to a cautious market ahead of the CPI release.
- Key resistance for gold is at $4,744, and a breakout above this level could lead to prices reaching between $4,850 and $5,028.
Gold is trading at $4,677 on May 11, pulling back from last weeks high of $4,765 – a level the price shook off with only a day to go before the release of Tuesdays April CPI figures. Last week gold had gained 3.72% as oil prices plummeted, bond yields softened and there was a bit of good news from Iran with the easing of inflation fears. But all those tailwinds reverse if Tuesdays inflation numbers come in higher than expected.
The Setup: Two of Three Headwinds Reversed, But CPI Decides the Rest
This is not the first time gold has been battered by rising oil prices, inflation expectation, and rising interest rates, but a combination of oil going down, inflation expectations falling, interest rates coming down, and the US dollar weakening finally saw gold roses 3.72% last week. That chain of events hasnt been seen in months – but if Tuesdays CPI numbers are above what is expected, then gold has a few more hurdles before it can finally get the macro backdrop that has been good for the bulls since early February.
There were a couple of factors that made things a little more complicated over the weekend. The Iranian state news was saying Tehran was looking to expand it’s control over the Straits of Hormuz – a pretty maximalist negotiating position that puts it directly at odds with what was agreed with the MOU framework. And just to add some more tension to the mix US military officials were supposedly briefing Trump on the possibility of taking on Iran. When Trump confirmed that the naval blockade was still in place until a nuclear agreement is reached all that just left gold opening lower on Monday.
World Gold Council numbers confirmed that gold demand for Q1 26 was a massive 1231 tonnes – worth a record $193 billion. That demand was driven by a increase in the sale of gold bars and coins, and from central banks who just kept buying. CME’s Fedwatch tool is currently showing a 95.8% chance that there will be no rate cut in June – which is just another reason that gold hasnt been able to rise much, until at least the inflation numbers come in.
XAU/USD Technical Analysis: $4,744 Is A Key Level To Watch
One thing to keep an eye on is whether gold can bounce back above $4,744. This is a level it managed to close below last week – and if it fails to get back above it it could be heading for $4,850 – $5,028. But if the CPI numbers do come in high, then all that is going to put that all to the back of our minds and the price will likely shoot straight back down.
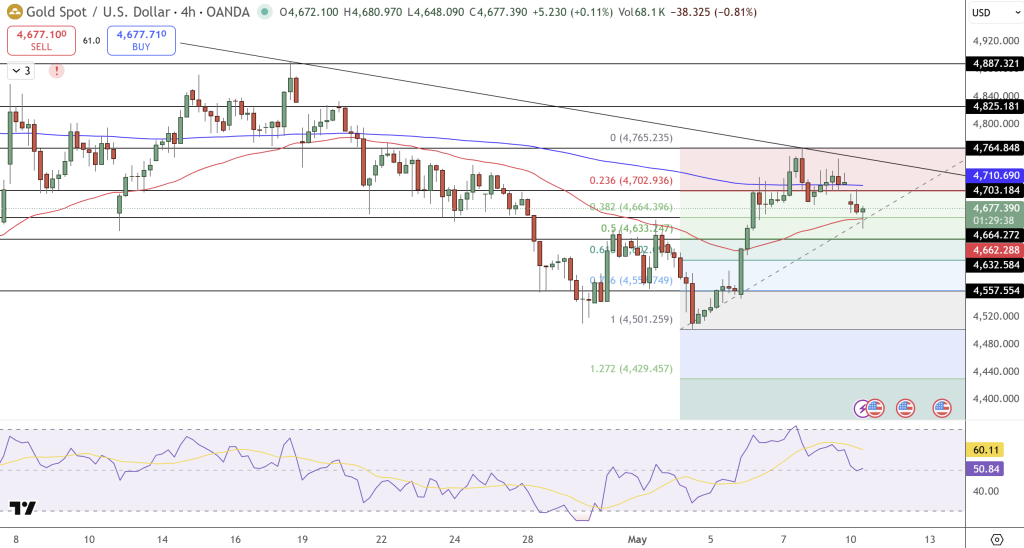
The 4 hour chart is looking pretty good for gold – we even saw a bullish hammer on the lower bound of the channel, which is still intact and the trendline coming down from $4,501 is still in place. As long as gold stays above $4,700 – a good psychological support level – then the overall structure is still technically in good shape, despite the early Monday morning volatility.
- Resistance: immediate $4,720 → weekly pivot / retracement level of $4,744 → $4,764 ( red moving average ) → $4,833 – $4,887 (upper channel).
- Support: $4,666 – $4,683 (Fibonacci cluster / moving average) → $4,557 (deeper support in the channel) → $4,501 (the structural base below)
The RSI is at 60 and that suggests we still have a bit of room for the price to keep rising, if the inflation numbers come in as expected.
Trade setup: Long if the price gets above $4,720 | target up to $4,764 – $4,833 | stop loss below $4,666
FAQ: Gold May 11, CPI Binary, Iran Sovereignty Claim, $5028 Price Target
Why has gold been selling off on Monday May 11 following a 3.72% rise last week?
Two new developments over the weekend have introduced fresh negative pressure: the claim by Iran that the Strait of Hormuz is Iranian sovereign waters suggests a tougher negotiating stance for the MOU, while US military discussions regarding military action against Iran add an escalation risk. Both issues support the dollar slightly and remove the rate cut hopes that caused the surge in gold prices last week. The positioning is driven mainly by traders de-risking before the Tuesday CPI data print by refraining from taking a strong directional stance, with $4700 as the threshold that separates holding a constructive bias or selling off into $4666 in a risk-off move.
What are the two scenarios for gold this week related to CPI?
A lower-than-expected CPI is bullish as yields fall further, dollar drops and gold moves clearly toward the resistance area of $4744 to $4850, versus a higher CPI print which quickly invalidates last week’s rally in a reversal: yields higher, dollar stronger, and gold sells off as the narrative of higher rates for longer returns. April CPI forecast consensus is around 3.1%, with readings below 3% triggering a bullish reaction, while those above 3.5% would reverse the current trend.
What’s the gold price target if $4744 breaks with soft CPI print?
A breakout through $4744 would pave the way to $4850 to $5028, the next significant institutional resistance zone. LiteFinance forecasts gold to be trading between $4380 and $5100 by May, while the broader analyst forecast by year end stands between $5400 to $6000. WGC’s $193 billion record Q1 demand shows institutional confidence at the present levels, supporting the bullish thesis. The fundamental bid remains and CPI is the only data set that may be delaying but not reversing the move toward $5000.
- Check out our free forex signals
- Follow the top economic events on FX Leaders economic calendar
- Trade better, discover more Forex Trading Strategies
- Open a FREE Trading Account
- Read our latest reviews on: Avatrade, Exness, HFM and XM
Related Articles

Sidebar rates
Related Posts
Ava

