Bitcoin Stuck Below $82K as 200-Day MA Becomes the Line in Sand
Either BTC breaks above and stays there, or it gets rejected and rolls over. Right now, technicals suggest backing away from resistance.

Quick overview
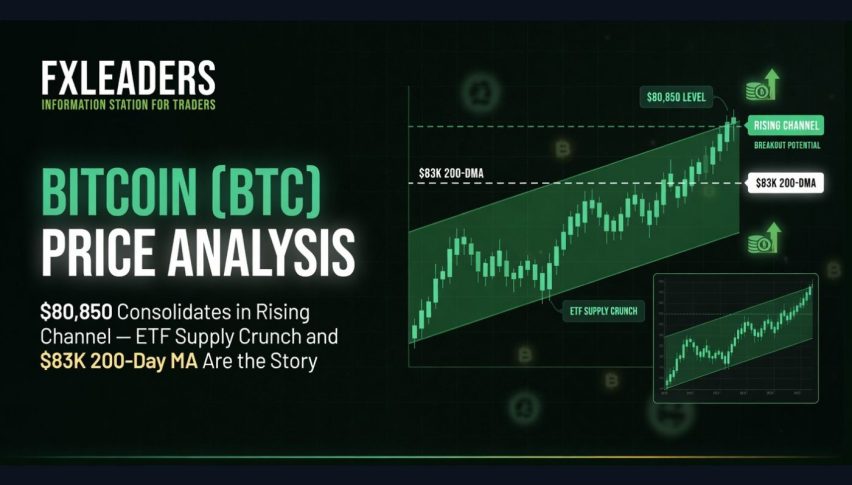
- Bitcoin is currently trading below its 200-day moving average at $82,464, with tight daily ranges complicating technical analysis.
- Short-term support is at $80,921, and if that level is lost, Bitcoin could quickly drop to $79,036.
- Despite recent institutional inflows and a 4.5% surge last week, Bitcoin has not yet broken through resistance, leading to consolidation.
- The market remains uncertain due to geopolitical tensions and light trading volume, with the key focus on whether Bitcoin can break above $82,464.
Bitcoin’s pinned below its 200-day moving average at $82,464. That level’s become the fight. Either BTC breaks above and stays there, or it gets rejected and rolls over. Right now, technicals suggest backing away from resistance.
Carol Harmer from Charmer Trading says daily ranges are so tight even pivot points aren’t working like usual. Today’s DP sits at $81,831 and Bitcoin’s trading under it. Short-term support’s at $80,921. Lose that and $79,036 comes into play fast.
A clean break above $82,464 flips everything. Then you’re looking at $83,437 and $84,276 as near-term targets. But that requires sustained momentum, not just a quick spike that gets faded.
The choppy action comes after Bitcoin surged 4.5% last week on solid ETF inflows. Six straight weeks of institutional money flowing into spot Bitcoin products. BlackRock’s IBIT dominated again. But that buying hasn’t translated into breakout price action yet. Just consolidation below resistance.
Geopolitical noise isn’t helping. Trump rejected Iran’s latest peace proposal. Markets don’t like uncertainty. Bitcoin briefly touched $82K earlier this week when macro conditions improved, then gave it all back once Iran tensions flared again.
Volume’s been light. About $37 billion in 24-hour turnover according to CoinMarketCap. That’s okay but not screaming conviction from either bulls or bears. When ranges compress like this, eventually something breaks. Question is which direction.
ETF flows tell one story. Institutional demand stayed consistent through April and into May. But on-chain metrics show whale wallets that bought in the last 155 days have an average cost basis around $80,300. Ali Charts pointed out Bitcoin trading below that level means new whales are underwater. That creates resistance when price approaches breakeven for recent large buyers.
Exchange reserves keep dropping. Less Bitcoin sitting on trading platforms means tighter supply available to sell. Normally bullish. But it hasn’t mattered yet because demand isn’t overwhelming the selling pressure around $82K.
The four-year cycle narrative keeps getting tested. Some analysts expect Bitcoin to eventually revisit and exceed the $126K all-time high if macro doesn’t break. Others think this consolidation could extend for months before the next major move.
K33 Research suggests long-term holder selling is slowing. They project BTC’s 2-year supply ending its downtrend by year-end 2026. Nearly 20% of total supply already got reactivated over the past two years. Sell-side pressure might be approaching saturation, which would flip dynamics in favor of buyers.
For now though, $82,464 is the level. Everything else is just noise until Bitcoin either breaks above and holds or fails and drops toward $79K.
- Check out our free forex signals
- Follow the top economic events on FX Leaders economic calendar
- Trade better, discover more Forex Trading Strategies
- Open a FREE Trading Account
- Read our latest reviews on: Avatrade, Exness, HFM and XM
Related Articles


Sidebar rates
Related Posts
