Silver Weekly Outlook: $76 After 10.6% Flash Crash — Rate Hike Pricing and the June 17 FOMC Dot Plot Are Now the Story
Silver ended the week near $76, plummeting 10.6% in a single session on May 15, a sharp selloff that stands as the largest one-session...
Quick overview
- Silver experienced a significant drop of 10.6% in a single session on May 15, marking the largest one-day loss of 2026.
- The gold-silver ratio increased from 53.6:1 to 58.9:1, indicating that silver was more adversely affected by rising interest rate expectations following the CPI report.
- Despite the selloff, the fundamentals for silver remain strong, with ongoing structural deficits and industrial demand projected to continue.
- The next key event for silver's trajectory will be the June 17 FOMC meeting, which could influence interest rate decisions.
Silver ended the week near $76, plummeting 10.6% in a single session on May 15, a sharp selloff that stands as the largest one-session silver loss of 2026. In just 24 hours, the gold-silver ratio expanded from 53.6:1 to 58.9:1, signaling that silver absorbed twice the blow from the CPI data as gold. The fundamentals remain unchanged: structural deficits and industrial demand are intact. What has changed is the trajectory of interest rates. The June 17 FOMC meeting is now the next confirmed point where that could shift, or remain steady.
Why Did Silver Drop 10.6% in One Day?
The April CPI report came in at 3.8% year-over-year, while the PPI climbed to its biggest monthly gain since early 2022. Overnight, the CME FedWatch dropped from a 48% chance of a June rate cut to nearly 0%, and now shows a 50% probability that rates will rise in December. Silver fell 10.6% while gold declined 1.83%, with the ratio expanding from 53.6:1 to 58.9:1 over the course of the day. That’s the whole story: silver is both an industrial metal and a currency.
Like gold, it gets crushed on rate hikes. Unlike gold, it also gets hammered by fears about a growth slowdown as the Fed gets more hawkish. Both drivers hit silver at the same time after this CPI print made a rate hike more probable. The hot CPI configuration that preceded this selloff has historically been followed by the sharpest physical gold and silver accumulation cycles on record, not their ends. This is a pause.
Prior to May 13, FedWatch was showing a 48% probability of a June rate cut. After the April CPI report showed a reading of 3.8% (versus a consensus 3.7%), that probability quickly fell below 8%. First-cut pricing now looks like September at the earliest, most likely November or December. The structural backdrop remains.
The Silver Institute still forecasts a deficit in 2026 that will push silver into its sixth straight annual shortage: 46.3 million ounces. The cumulative silver stock drawdown has hit 762 million ounces since 2021. The pattern when the Fed eventually eases is consistent, the 2025 easing cycle sent silver from $29 to $121. This is a pause, not a breakdown. The next scheduled event: the June 17, FOMC rate decision.
XAG/USD Technical Analysis: Channel Support Tests at $75.80
On the 4-hour, silver is currently trading at $76 and testing the support line of an ascending channel. The trend started from the May $67.40 low. The RSI is at its lowest on the 4-hour chart for this channel at 26-49 and shows strong positive divergence.
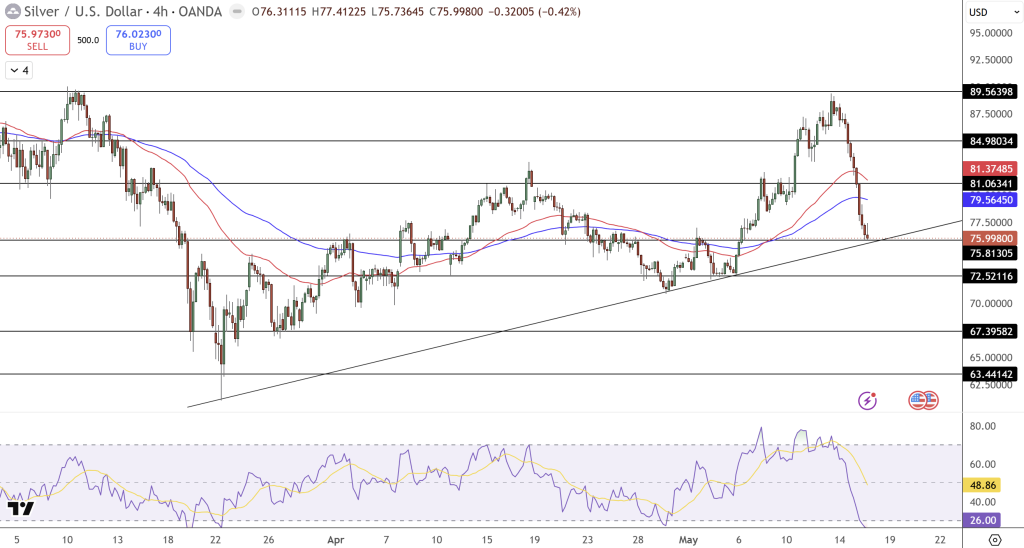
Historically, such readings have often marked short-term turning points in precious metals trading. Resistance levels at $79.56 (blue MA) and $81.06, before topping out at $84.98. Support is found at $75.81 (red MA / channel trend line), followed by $72.70 (deeper Fibonacci level) and ultimately the $67.40 channel base.
Entry above $76.50 | Exit at $79.56 to $81.06 | Stop loss below $75.80
Frequently Asked Questions About The CPI Sell-Off: Gold-Silver Ratio, Silver Price Targets, and The FOMC
Silver sold off 10.6% while gold only declined 1.83%. How can this be?
The short answer is that it’s both a monetary and industrial metal. That means when the CPI print shocked the markets to price in a higher chance of rate hikes, it impacted silver on both fronts. The rate hike expectation hurts the monetary metal component. But unlike gold, the industrial metal portion also gets crushed as the market gets nervous about the growth impact of tighter monetary policy. When the gold-silver ratio jumped from 53.6:1 to 58.9:1 in less than 24 hours, the quantitative impact is the same, more people are dumping silver than gold.
Is the silver bull market structurally broken?
No. The silver market tends to consolidate whenever the Fed doesn’t cut. After last week’s CPI print, that consolidation has become extended, but this is not a breakdown. The 2026 deficit forecast (46.3 million ounces) is still in place.
There are still 762 million ounces of above-ground stock being drawn down since 2021. And the industrial demand (solar, EVs, AI data centers) is all unchanged. It is the interest rate path that has been altered.
The rate hike scenario for the June 17 Fed meeting will extend this pause until Q3, while any signal of an earlier cut will give the metal plenty of runway.
What is the silver target after this selloff?
In the near term, a successful bounce off the channel support should test $79.56 to $81.06. The $84 to $85 level, which is also home to the 200-day moving average, will need to be broken. A signal from the June FOMC meeting that the Fed will cut at the September meeting would likely give the commodity room to challenge that level.
The gold-silver ratio is trading at 58.9:1, this is neither too high nor too low. A move from 58.9 to 40 to 50 would suggest silver has more room to move. Silver is not fundamentally expensive or cheap. The structural move higher to $100+ is still valid. It will just have to wait longer.
- Check out our free forex signals
- Follow the top economic events on FX Leaders economic calendar
- Trade better, discover more Forex Trading Strategies
- Open a FREE Trading Account
- Read our latest reviews on: Avatrade, Exness, HFM and XM
Related Articles


Sidebar rates
Related Posts
