Forex News and Market Analysis
Wednesday, June 17, 2026
Guilty Plea for “Bitcoin Rodney”- Jamie Foxx’s Friend Involved in $1.8 Billion Crypto Scam
2 min read

This week, Rodney Burton, known as “Bitcoin Rodney”, pleaded guil ...
7 minutes

On Tuesday, the Dow Jones Industrial Average reached a record in ...
2 hours
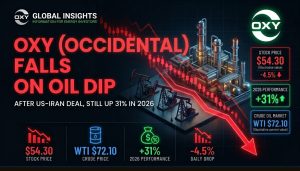
Occidental Petroleum company stock failed to stop its previous days negative performance and is show ...
4 hours

Bitcoin's hanging on at $65,051 T ...
5 hours


Super Micro Computer (SMCI) stock has failed to halt its negative performance and is showing a very ...
5 hours

The global energy matrix has undergone an aggressive structural realignment, completely erasing its ...
7 hours
XRP Price Prediction: $1.24 Re-Entry Target Locked as Bipartisan CLARITY Act Heads to Senate Floor
3 min read

XRP is executing a powerful, institutional-level decoupling, positioning itself as a leading safe-ha ...
7 hours
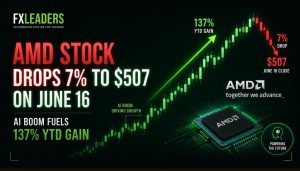
Advanced Micro Devices (AMD) stock failed to extend its previous positive performance and is showing ...
9 hours
Rivian Slides 4.5% as Cost Cuts Overshadow R2 Launch, But Technical Setup Holds Key Support
3 min read

Rivian shares fell 4.5% to $15.93 on June 16 after the electric vehicle mak ...
11 hours
Gold Surges on US-Iran Peace Breakthrough
1 min read

Gold prices rose as the US and Iran prepared to sign a temporary peace agreement that might ease war ...
11 hours


...
11 hours

Iron ore prices fell below $100 per ton amid indications of high seaborne supplies at a time when Ch ...
11 hours
Gold Price Forecast: $4,375 Resistance Breakout Visualized as Warsh Debut Triggers FOMC Countdown
3 min read

The worldwide bullion market has come to a standstill, with daily trading volumes essentially capped ...
12 hours

SpaceX surged for the third day in a row, surpassing Amazon. com in value to rank as the world's fif ...
12 hours
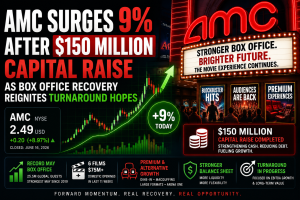
AMC Surges 9% After $150 Million Capital Raise as Box Office Recovery Reignites Turnaround Hopes
3 min read
...
12 hours
Western Digital Hits Record High Above $681 as AI Storage Boom Drives Wall Street Target Hikes
3 min read

...
15 hours

...
16 hours

...
16 hours
When it comes to the markets, staying abreast of important economic events and breaking news
items is a full time job. Whether one is an active day trader or a long-term investor, the need to be current is one that must be satisfied every
single day. The FX Leaders news feed is a great way to stay on top of the evolving global
marketplace.
Everything You Need In An FX News Service
All Things Forex News, 24 Hours A Day, 5 Days A Week
Sidebar rates
