WTI Recovers from its Open – On Set to Confirm Breakout of Major Resistance
Crude oil prices opened on low from yesterday’s close but managed to gain momentum to confirm the breakout candle from yesterday.


Crude oil prices opened on low from yesterday’s close but managed to gain momentum to confirm the breakout candle from yesterday.
WTI futures had a bullish week gaining 4.4% so far over the past 5 trading sessions. The readjustment upwards yesterday from the IEA on its projection for demand also gave the bulls the extra steam needed to reach the current levels.
The reviewed projection aligns with OPEC’s earlier demand projections for 2024 and 2025. The IEA stated supply cuts and geopolitical risks in the Middle East. While the OPEC had already confirmed an extension of its supply cuts in 2024.
Technical View
The day chart below for WTI shows a large triangle formation that started at the beginning of last December. The upwards sloping shape usually gives rise to more bullish momentum. However, you need to wait for the breakout of the pattern, and we got that yesterday.
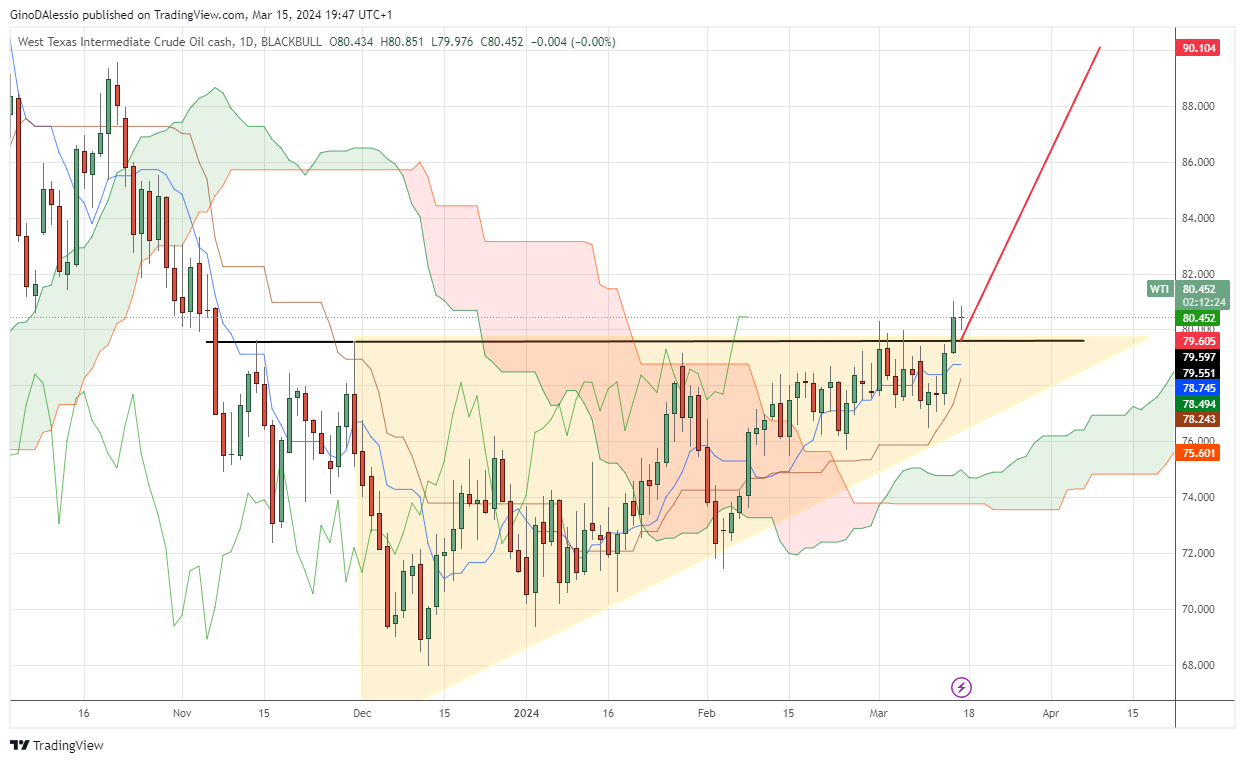
Today’s candle looks like it’s about to give us confirmation, if it closes above the resistance line (black line). The significance of the pattern is also determined by the number of candles contained within it.
In this example, we have a large number of sessions and a wide range in the vertical side of the triangle. To get the base for the projection higher you take the difference between the high and low on the vertical side of the triangle.
That equals $11.54, which you the add to the level of the resistance line (black line). The projection higher (red line) gives the next resistance at $90.104. That level also coincides with a previous peak on October 23, 2023.
- Check out our free forex signals
- Follow the top economic events on FX Leaders economic calendar
- Trade better, discover more Forex Trading Strategies
- Open a FREE Trading Account
- Read our latest reviews on: Avatrade, Exness, HFM and XM
Related Articles


Sidebar rates
Related Posts
Ava

