Ethereum Is Booming: Will Rising On-Chain Activity Pump Prices Above $3,700?
Ethereum remains within a bear formation. Even with Dencun, ETH has found resistance below $3,700. A breakout might lift the coin to $4,000

Ethereum is trading within a tight range, and is bearish at spot rates. Though prices moved slightly higher, the failure of traders to engage, driving volumes by higher margins over the weekend, should be a concern. Technically, ETH bulls have a chance, especially as long as prices are above $3,200. However, there might be clear entries above $3,700; pushing the coin above the current consolidation.
At spot rates, ETH is changing hands above $3,300, right in the middle of a protracted consolidation. On the last trading day, the coin is stable but down 4% in the past week. While Ethereum is under pressure, trading volume is picking up steam, adding 7% in the last day to $9.9 billion. This is still below average compared to historical levels of above $20 billion.
The following events might influence Ethereum prices in the short term:
- The Dencun upgrade was a major enhancement for the smart contracts platform. Developers planned to further slash transacting costs via layer-2 channels like Arbitrum. Data shows that layer-2 platforms have been processing, on average, 32 million transactions every week since Dencun. This revelation is a massive endorsement for ETH bulls.
- With rising transaction count and adoption, Ethereum generated $1.2 billion in revenue in Q1 2024, a 150% increase year-to-date. In Q1 2024, the network processed 107 million transactions as over 9.7 million unique addresses were created.
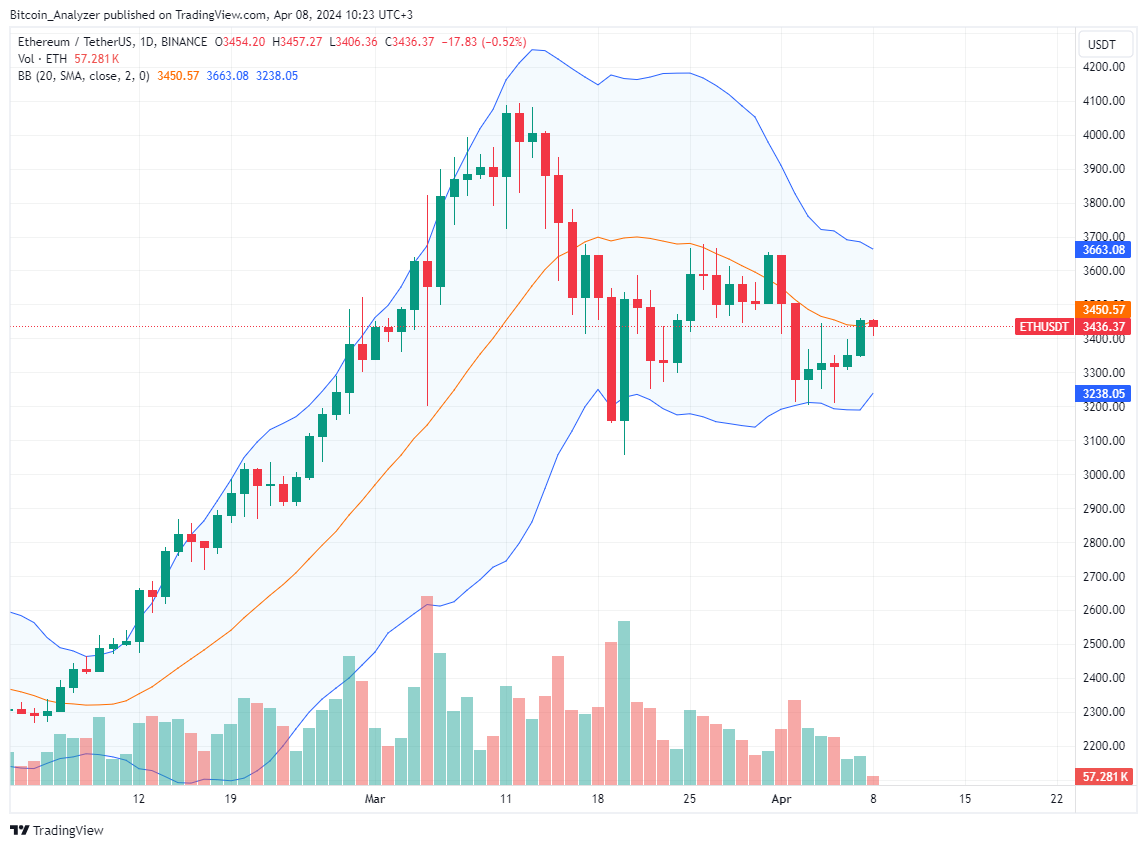
Ethereum Price Analysis
ETH/USD is within a bearish formation, looking at the formation in the daily chart.
Though prices are higher, they are trending within the bear bar of April 2. The bearish engulfing bar has yet to be reversed even after five trading days, which could suggest that buyers are finding it hard to absorb all positions.
Aggressive traders might sell on attempts higher below $3,500.
However, if there is a confirmation that sees Ethereum slide below April 2 lows and $3,200 with rising volumes, risk-on traders can hope in. In that case, ETH might fall to $2,600.
Any sharp breakout above $3,700 cancels this bearish forecast, paving the way for possible expansions to $4,000—or better.
- Check out our free forex signals
- Follow the top economic events on FX Leaders economic calendar
- Trade better, discover more Forex Trading Strategies
- Open a FREE Trading Account
- Read our latest reviews on: Avatrade, Exness, HFM and XM
Related Articles


Sidebar rates
Related Posts
