XAUUSD Analysis – FOMC To Require More Proof For Future Adjustments!
The price of Gold trades steadily higher during this morning’s Asian session and is attempting to break yesterday’s all-time high. Gold has risen more than 15% since February 2024 as investors look at an alternative hedge against inflation. Furthermore, several countries, such as China and India, aim to reduce their dependence on the Dollar prior to the US elections. However, it’s important for investors to acknowledge that if US inflation surpasses expectations, there could be a resurgence in demand for the Dollar.
Investors should be aware that the typical inverse relationship between Gold and the US Dollar appears slightly less pronounced. Consequently, despite a stronger Dollar, the price of Gold might experience a retracement or correction but could still maintain its long-term gains. According to the most recent report from the US Commodity Futures Commission, speculative positions favoring “sellers” remain limited. The latest data indicates that only 0.719k additional contracts were taken up by sellers, while buyers added more than 21.200k contracts.
Investors will also be closely monitoring the FOMC Meeting Minutes and not only the inflation data. If the meeting minutes advises members of the FOMC want more proof before lower interest rates, and inflation rises, investors will price in a more hawkish Federal Reserve. The head of the Federal Reserve Bank (FRB) of Dallas, Mrs Logan, advises it’s too early to think about lowering interest rates since the danger of inflation stabilizing above the target level remains.
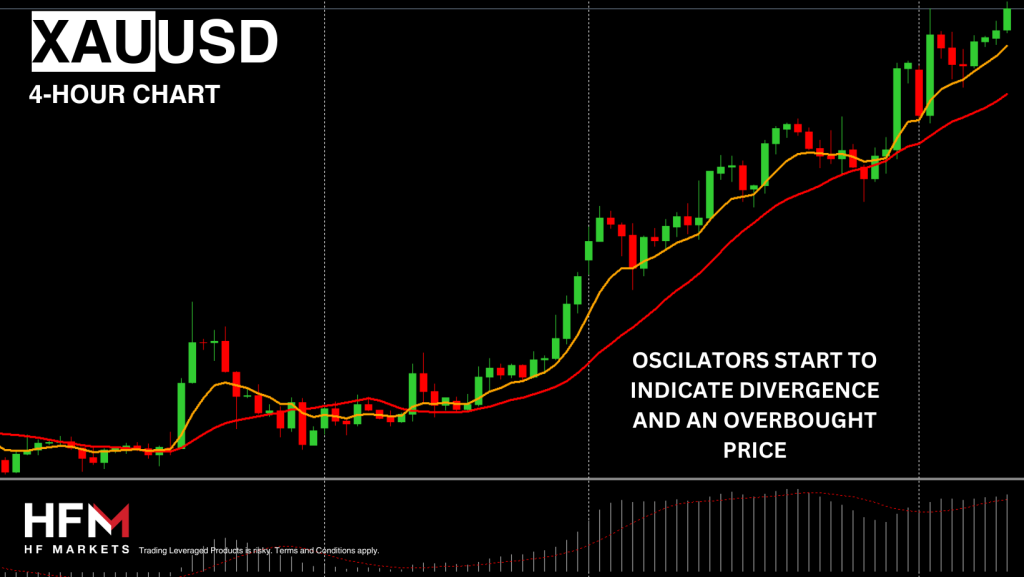
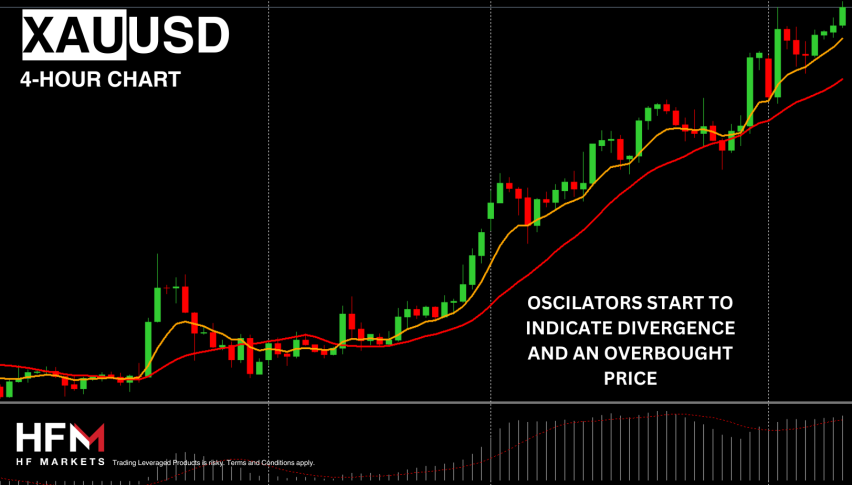
Technical analysis for Gold is two sided. Momentum-based indicators point towards an upward price movement as does price action. However, oscillators indicate the asset may be trading above its intrinsic value and may correct. A short-term correction may decline between 2,292.29 and 2,318.78. Though, regardless of some signs of the price being overbought there is not direct indication from the price momentum. Therefore, the bullish bias remains. For another bullish impulse wave, technical analysts point at a target of 2,376 based on Fibonacci levels and the size of previous impulse waves.
- Check out our free forex signals
- Follow the top economic events on FX Leaders economic calendar
- Trade better, discover more Forex Trading Strategies
- Open a FREE Trading Account
- Read our latest reviews on: Avatrade, Exness, HFM and XM
Related Articles


Sidebar rates
Related Posts
