⚡Crypto Alert : Altcoins are up 28% in just last month! Unlock gains and start trading now - Click Here

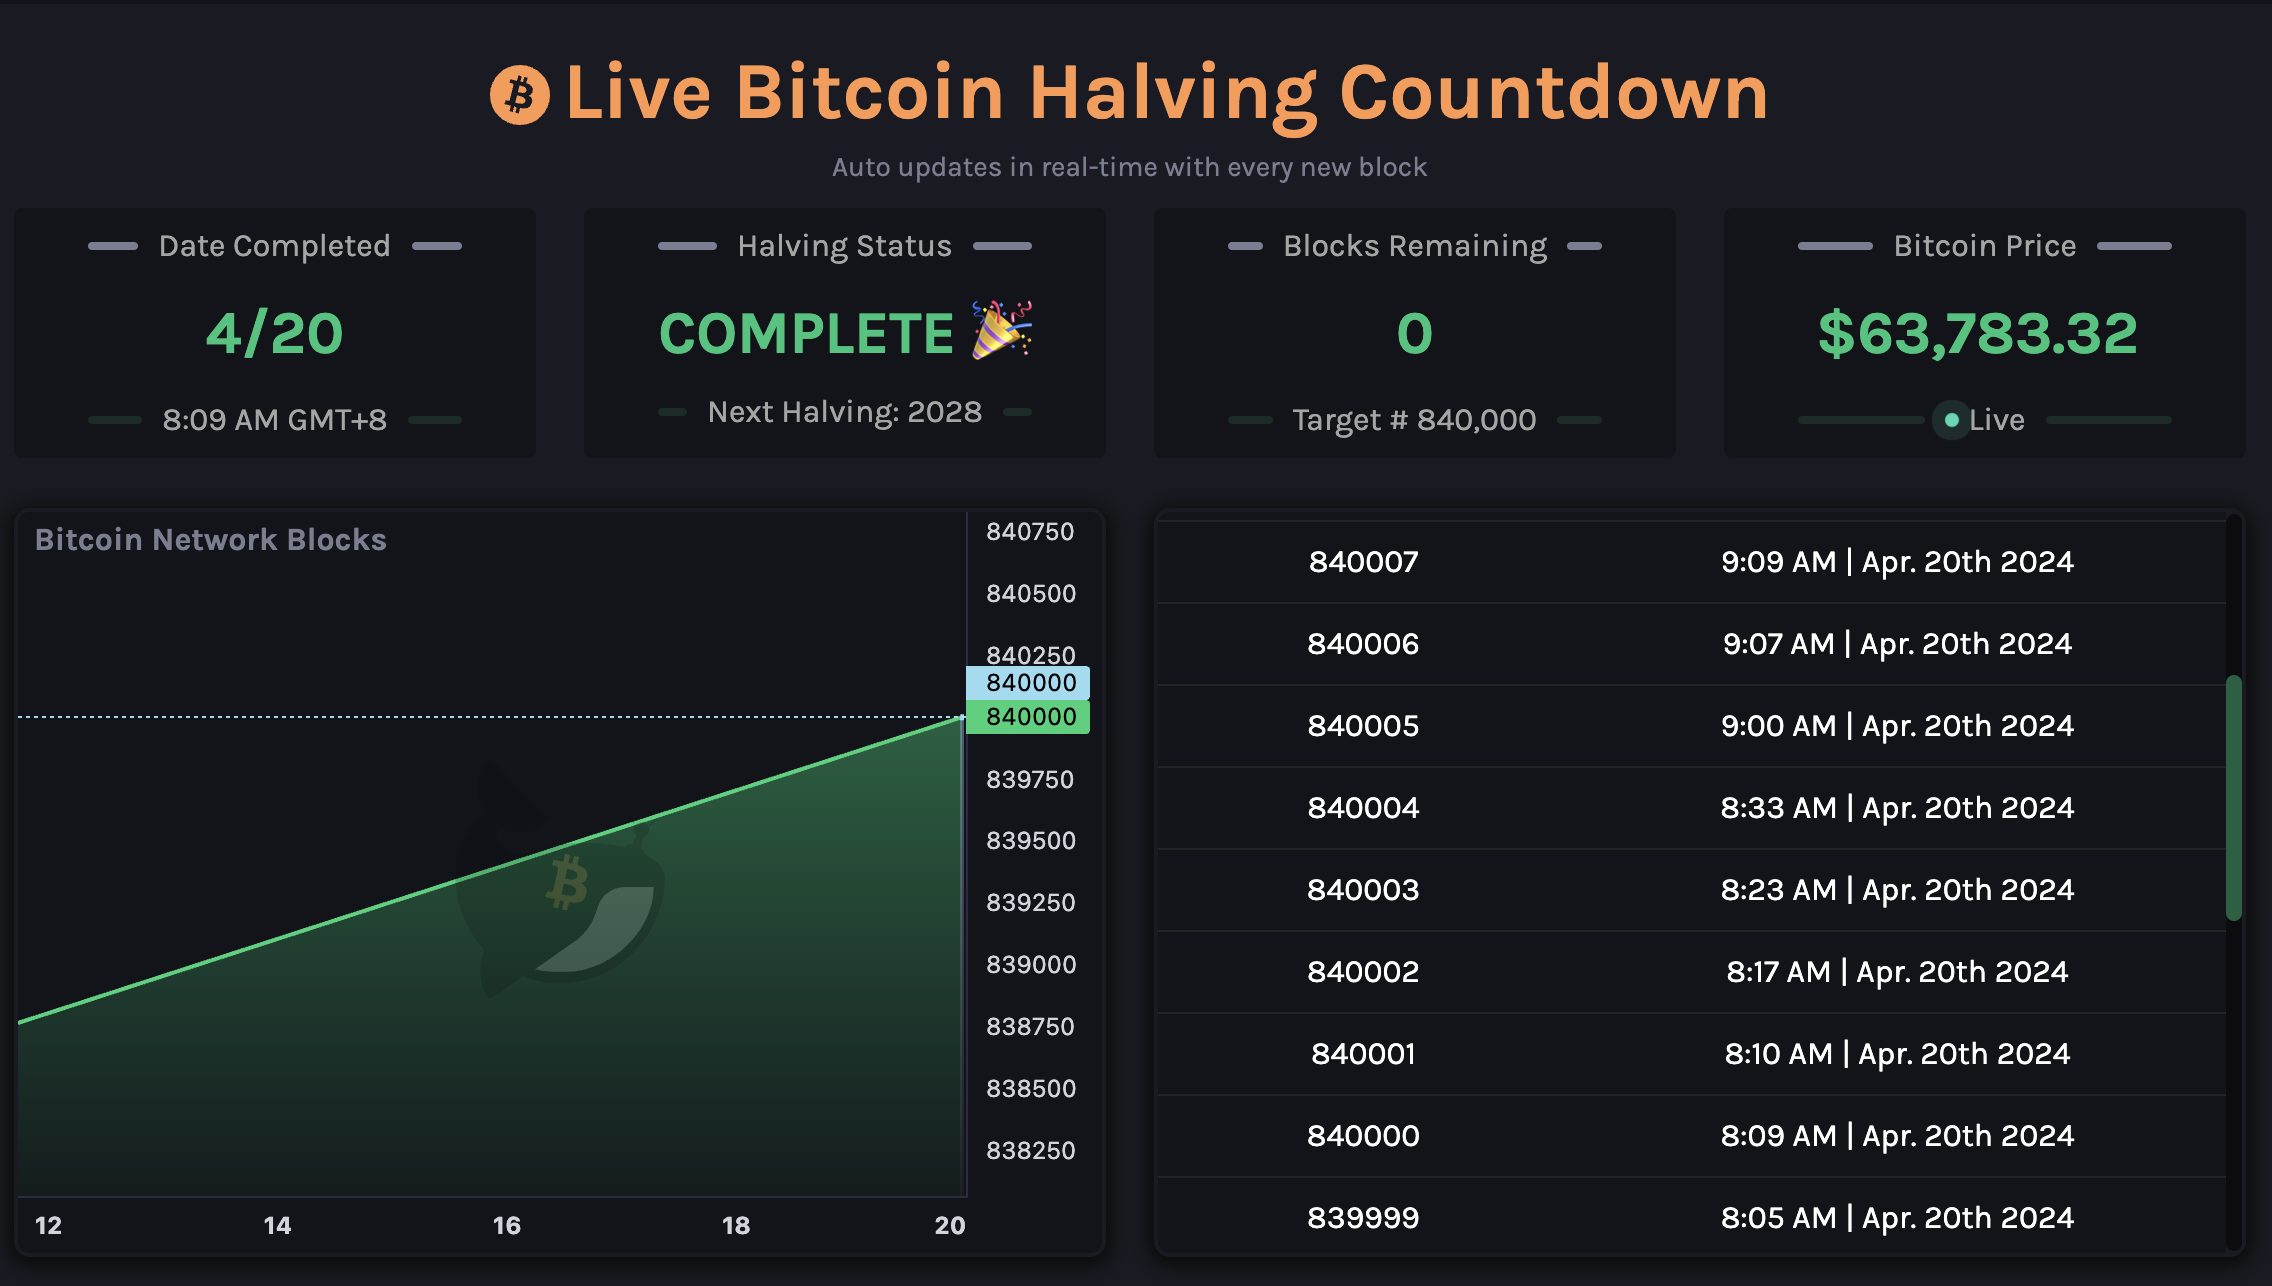
Bitcoin Halving Complete: What’s Next for BTC Prices?

BrokerReviewRegulatorsMin DepositWebsite
🥇Read ReviewASIC, FSA, CBI, BVI, FSCA, FRSA, CySEC, ISA, JFSAUSD 100Visit Broker >>
🥈Read ReviewFMA, FSAUSD 50Visit Broker >>
🥉Read ReviewFSCA, CySEC, DFSA, FSA, CMAUSD 0Visit Broker >>
4Read ReviewSFSA, FSCA, CySec*USD 5Visit Broker >>
5Read ReviewFCA, CySEC, FSCA, SCBUSD 100Visit Broker >>
6Read ReviewFCA, FINMA, FSA, ASICUSD 0Visit Broker >>
7Read ReviewCySEC, FCA, FSA, FSCA, Labuan FSAUSD 100Visit Broker >>
8Read ReviewNot Regulated0.001 BTCVisit Broker >>
9Read ReviewASIC, CySEC, FSCA, CMAUSD 100Visit Broker >>
10Read ReviewCySEC,MISA, FSCAUSD 20Visit Broker >>

The Bitcoin halving event was completed less than two hours ago, reaching block 840,000. Today, April 20th, 2025, marks the official date of this halving.

Given the recent completion of the Bitcoin halving, which traditionally reduces the supply increase rate by halving the block rewards, we’ve observed a not unexpected moderate price rally. Historically, halving events have been bullish catalysts for Bitcoin as the reduced supply rate often leads to upward price pressures, assuming demand remains constant or increases.

Bitcoin Halving Countdown Complete

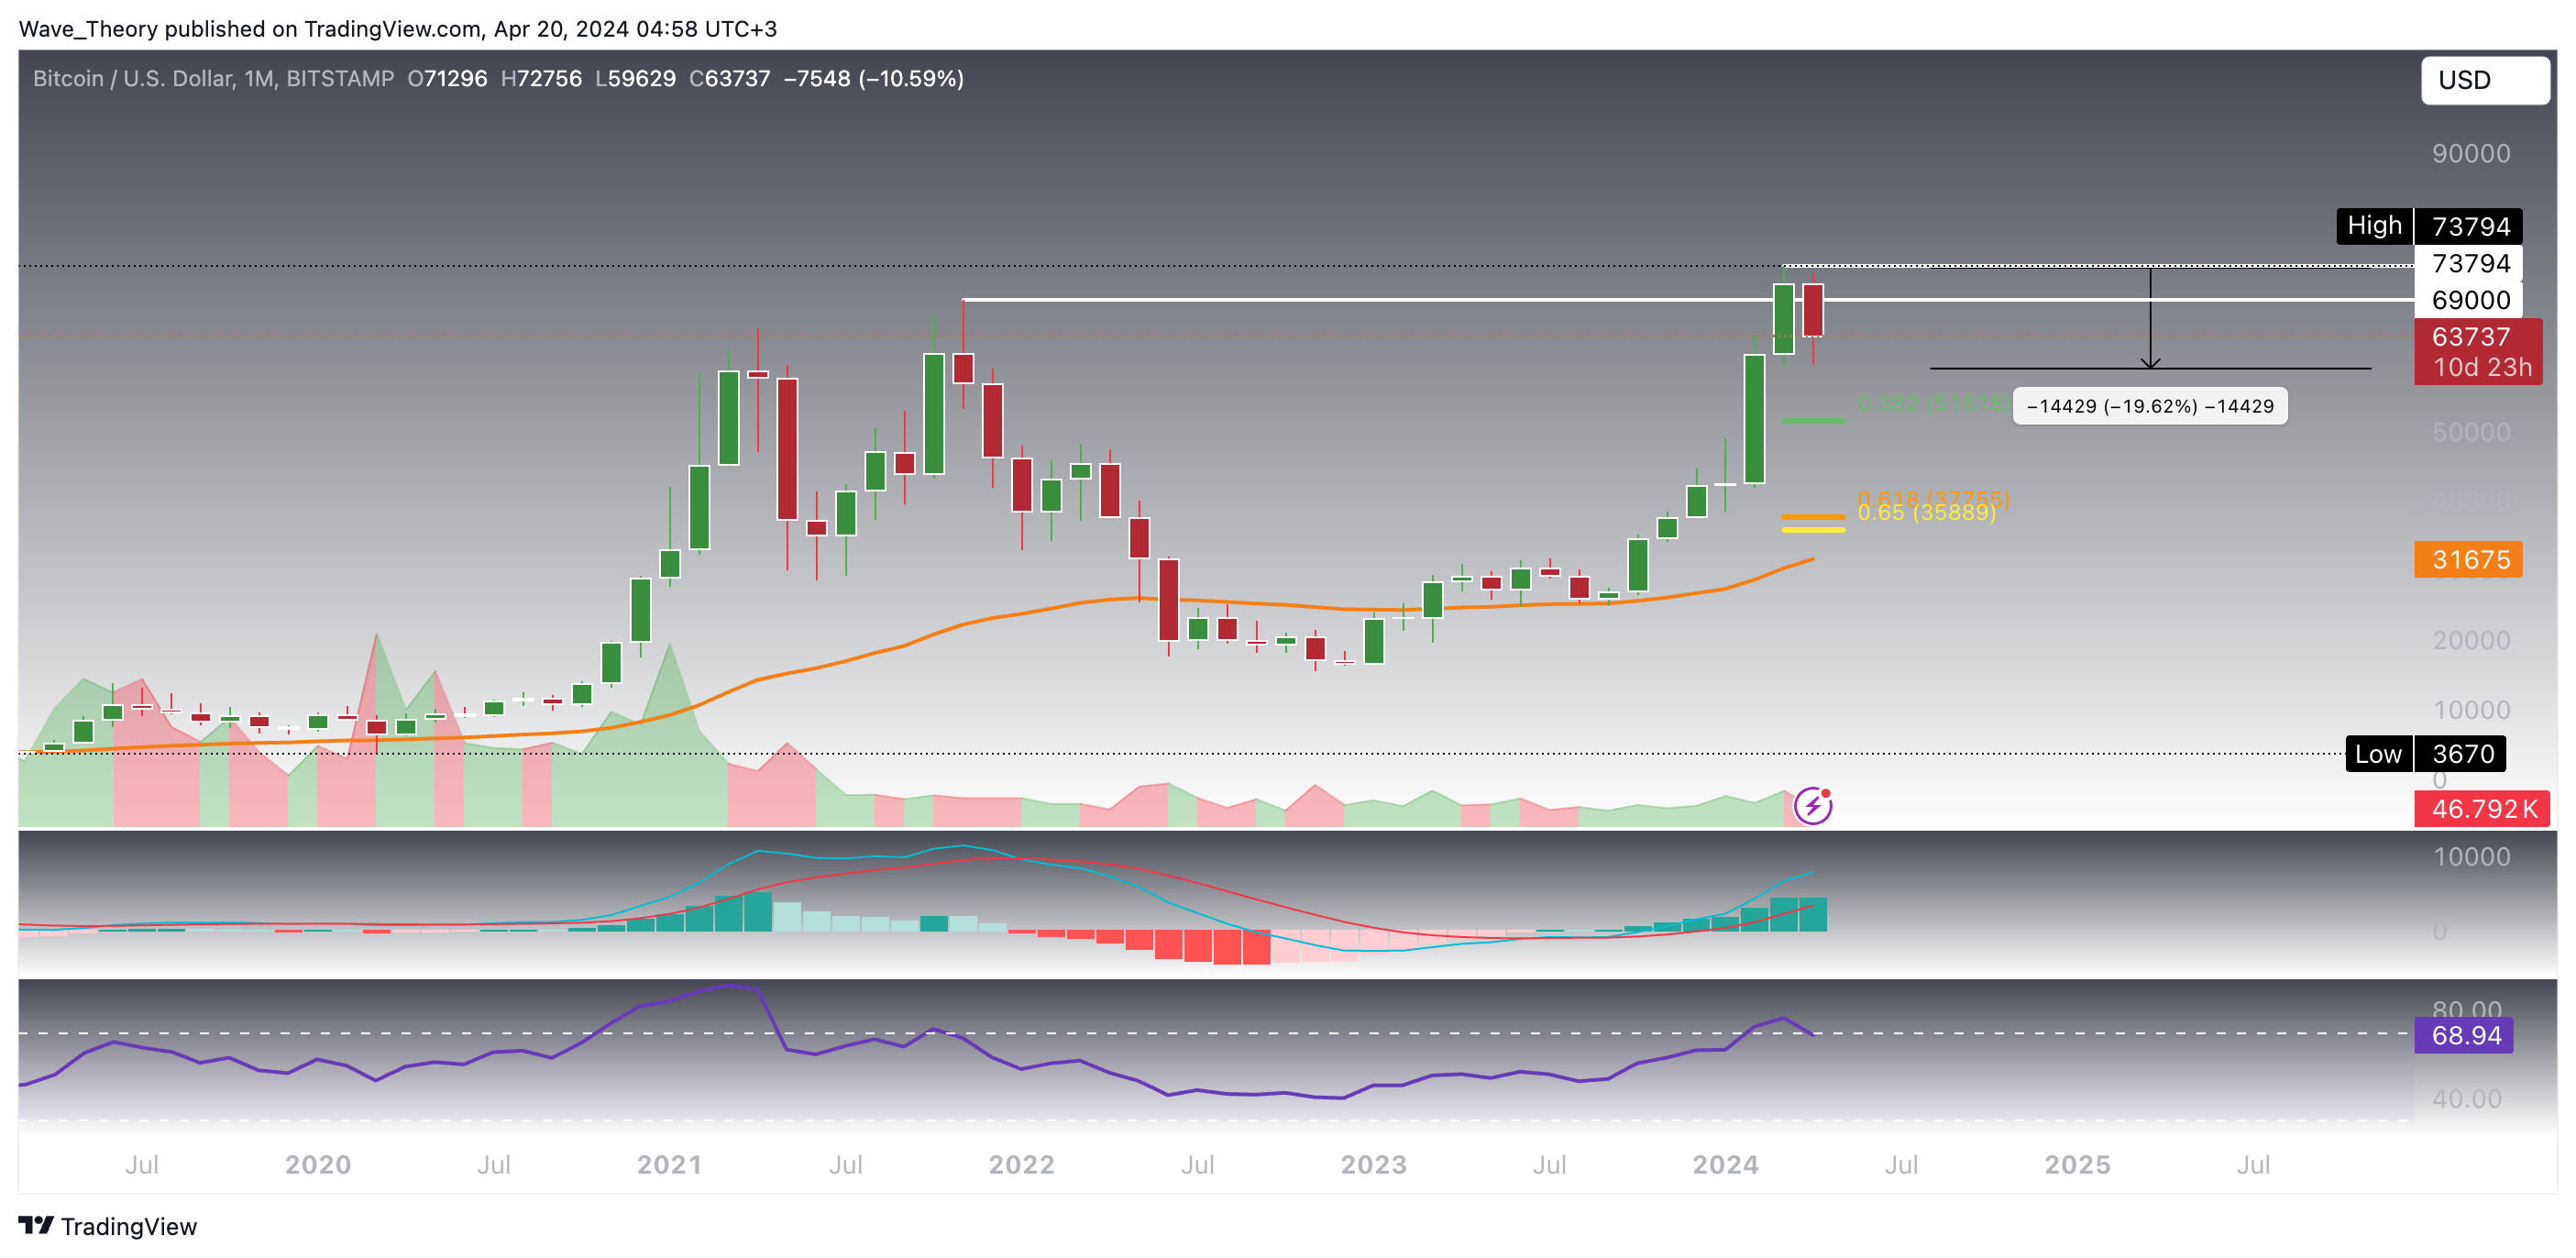
Bitcoin Experienced A Moderate Correction this Month

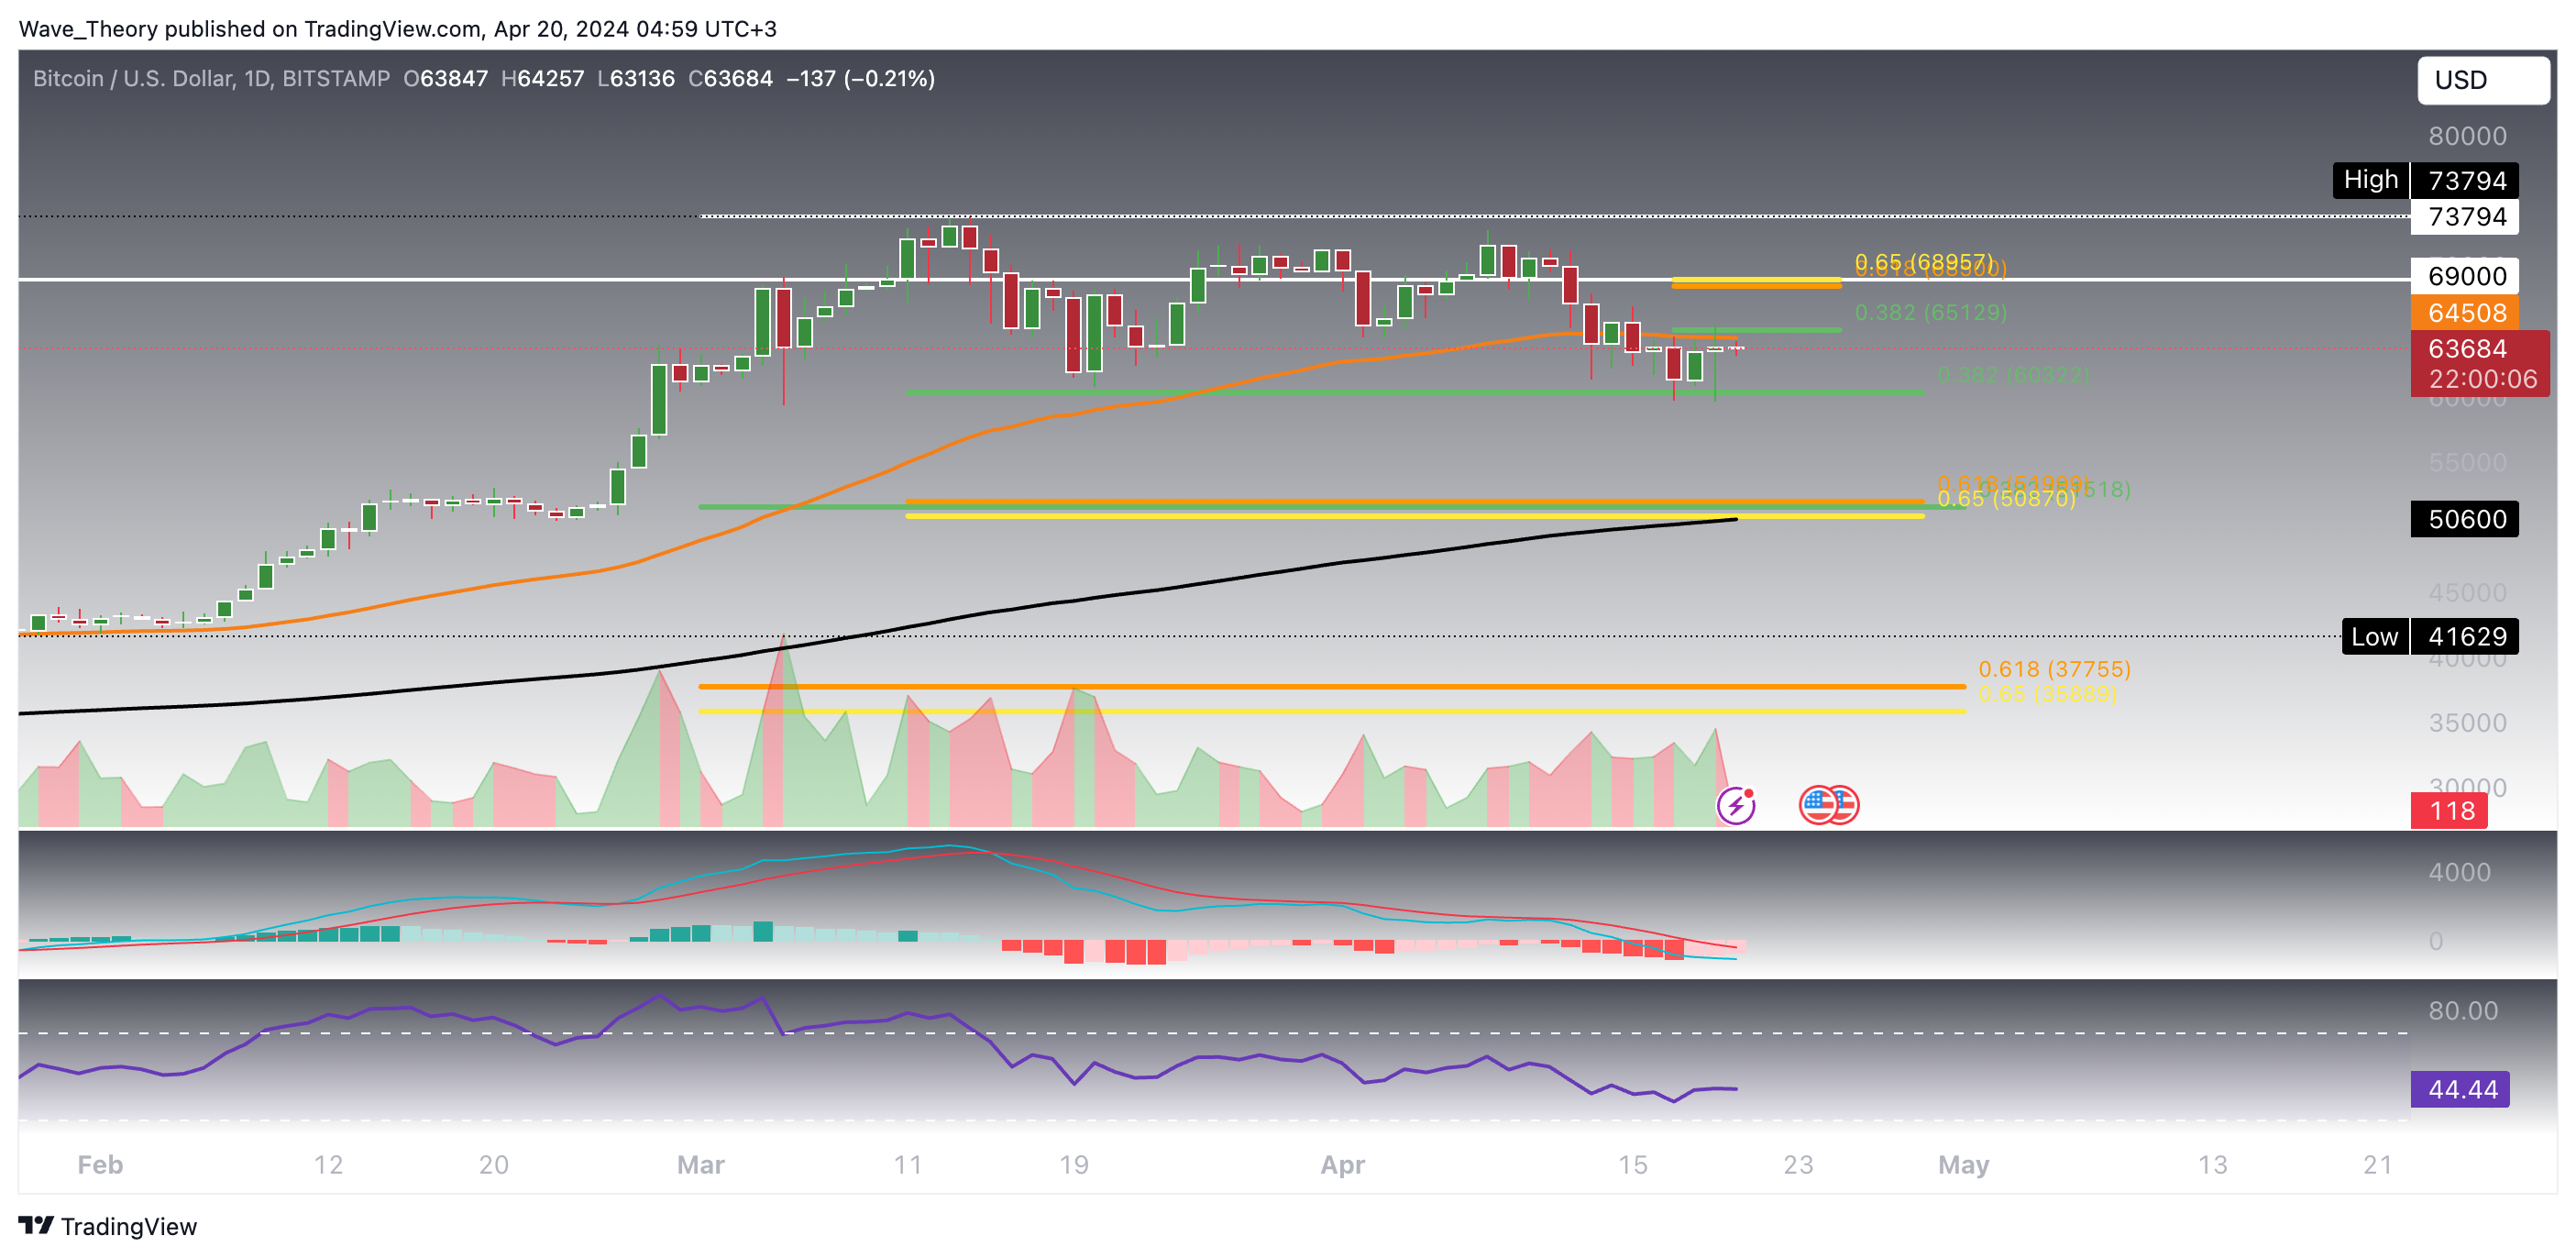
Currently, Bitcoin is undergoing a correction phase, having pulled back nearly 20% from its recent all-time high of approximately $73,800. Despite this retracement, key technical indicators suggest underlying strength in the market. The MACD histogram displays an ascending trend, and a bullish crossover on the MACD lines, coupled with a reentry into neutral territory on the RSI, underscores potential for continued bullish momentum.

From a support perspective, Bitcoin holds above significant levels: the golden ratio near $36,000 and the 50-month EMA around $31,675 provide robust long-term support.

Bitcoin Price Analysis Tradingview

Is Bitcoin Set To Rebound From The Fibonacci Support?

More immediately, Bitcoin is testing the 0.382 Fibonacci support at $60,322, where a potential bounce could occur. Failure to hold this level might expose the next significant Fib support around $51,000.

However, the MACD histogram has been declining for the third consecutive week, suggesting the possibility of an imminent bearish crossover in the MACD lines. In contrast, the EMAs continue to display a golden crossover, affirmatively signaling a bullish trend.

Bitcoin Price Analysis Tradingview

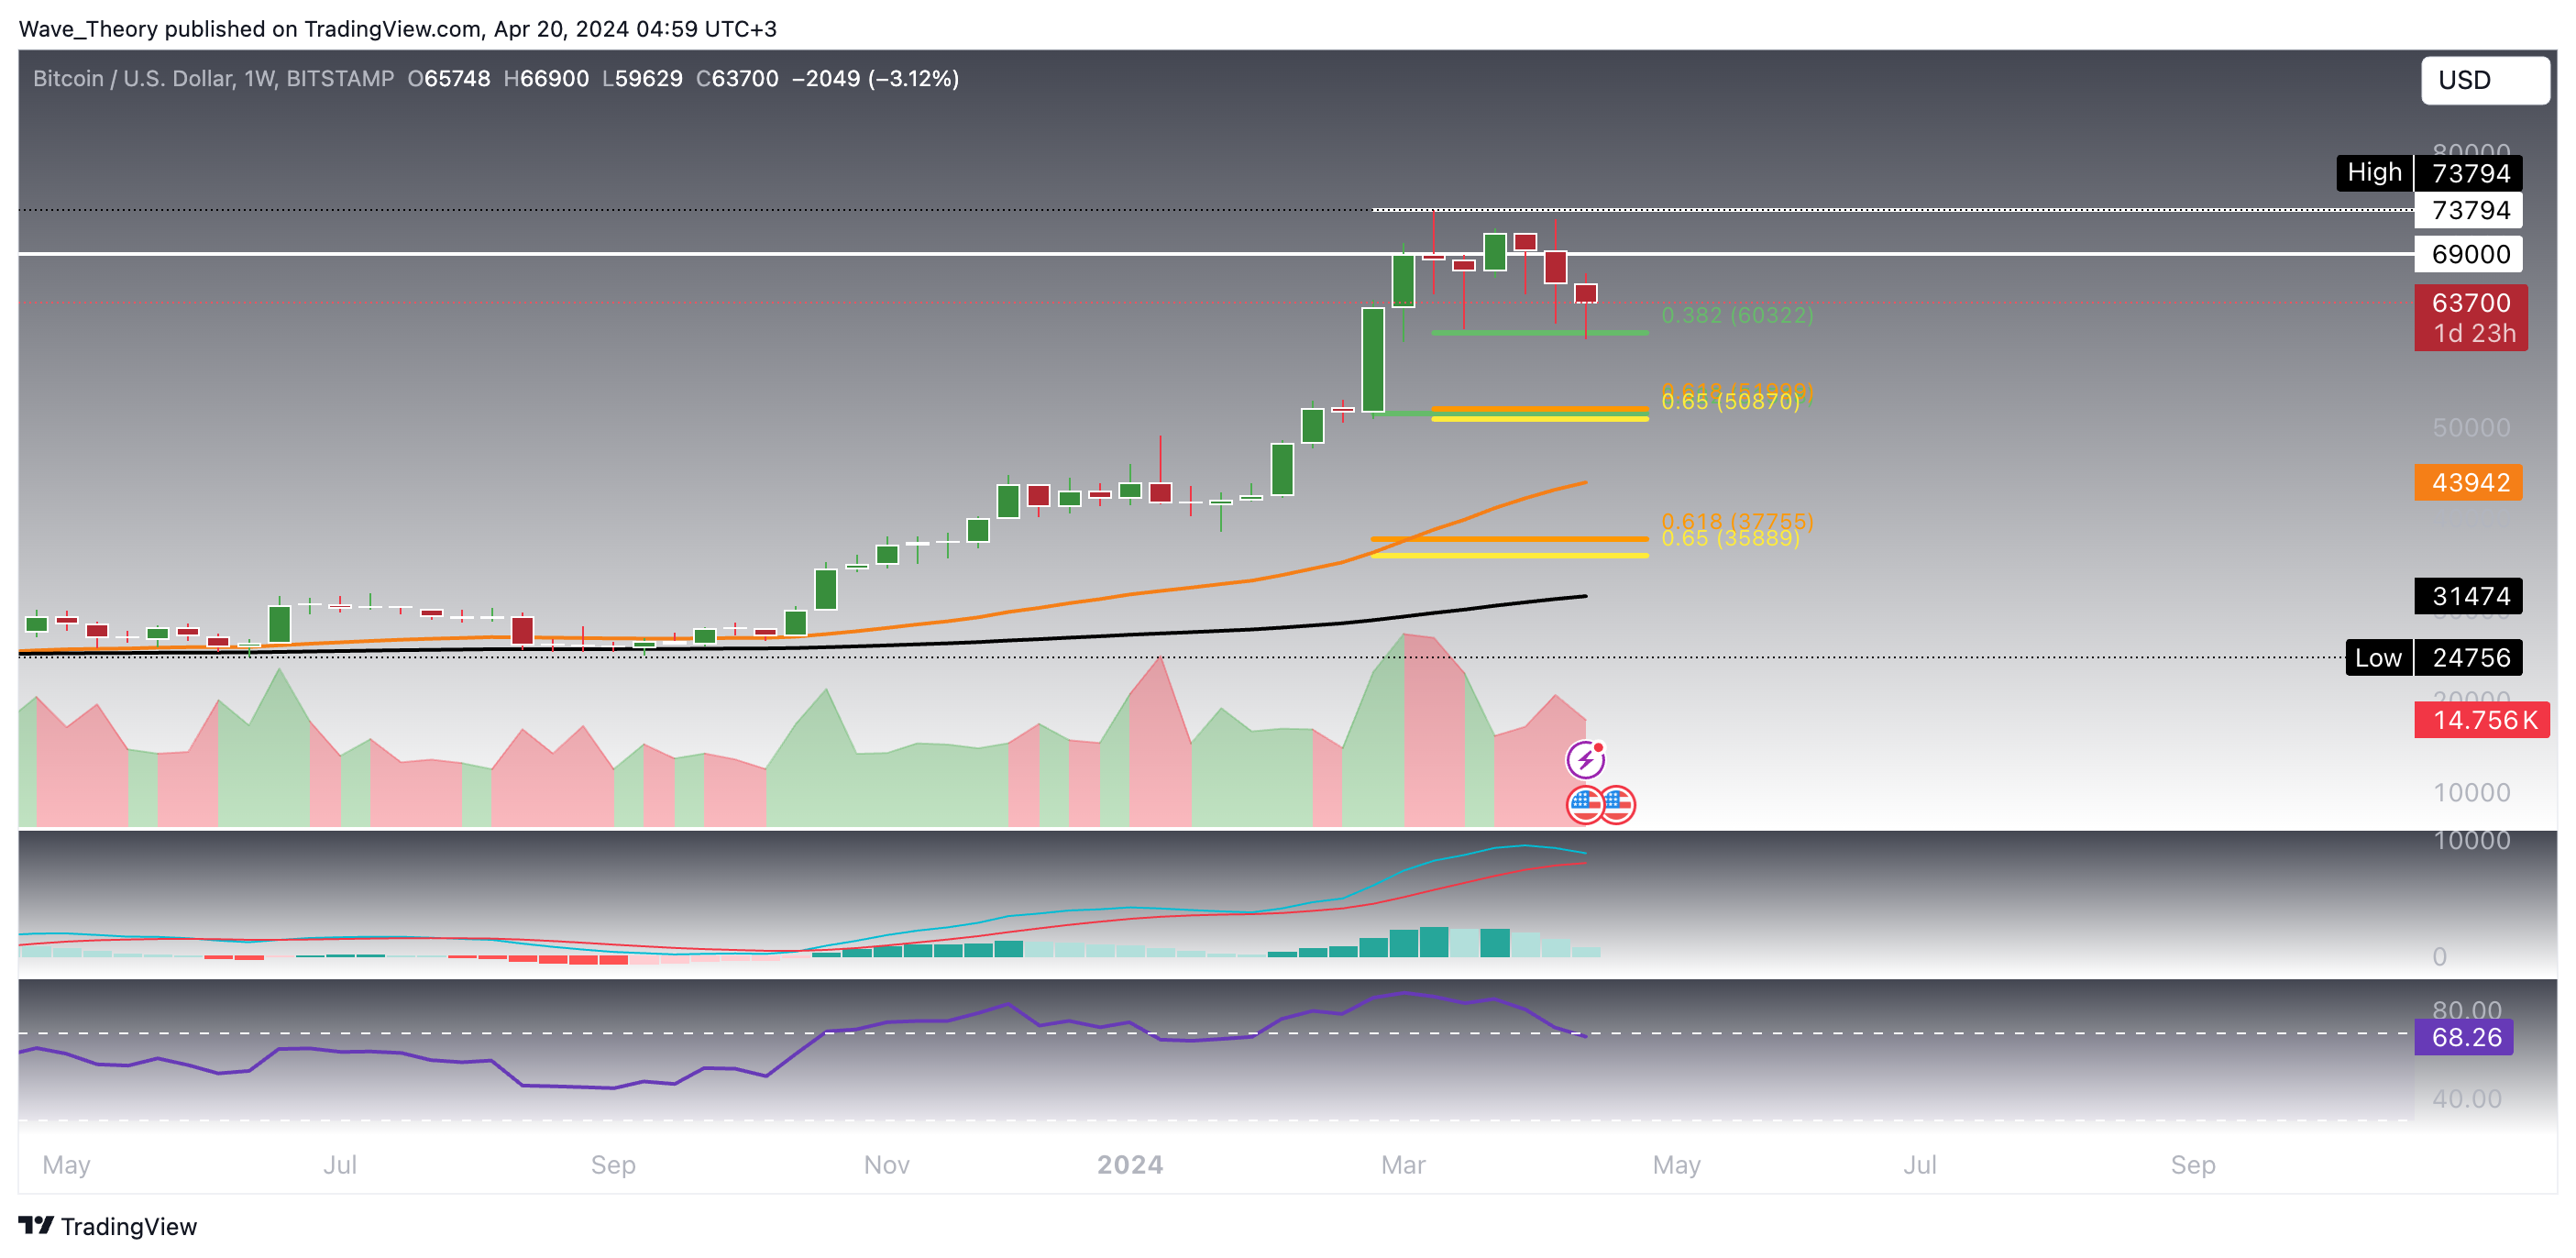
Is Bitcoin Poised To Surpass The 50-day EMA Resistance?

In terms of resistance, Bitcoin faces immediate hurdles at the 50-day EMA ($64,508) and Fibonacci levels at $65,129 and $68,950. A decisive break above these resistances, particularly the $68,950 Fibonacci level, would invalidate the current correction, potentially setting the stage for a new all-time high.

At present, the technical indicators predominantly suggest a bullish outlook. The EMAs have exhibited a golden crossover, a typically bullish signal. Additionally, the MACD histogram is ticking upward, indicating increasing bullish momentum. However, the RSI remains neutral, providing no clear directional cues. The only bearish note comes from the MACD lines, which are currently crossed in a bearish configuration. Nevertheless, this situation may change swiftly if Bitcoin resumes its upward trajectory.

Bitcoin Price Analysis Tradingview

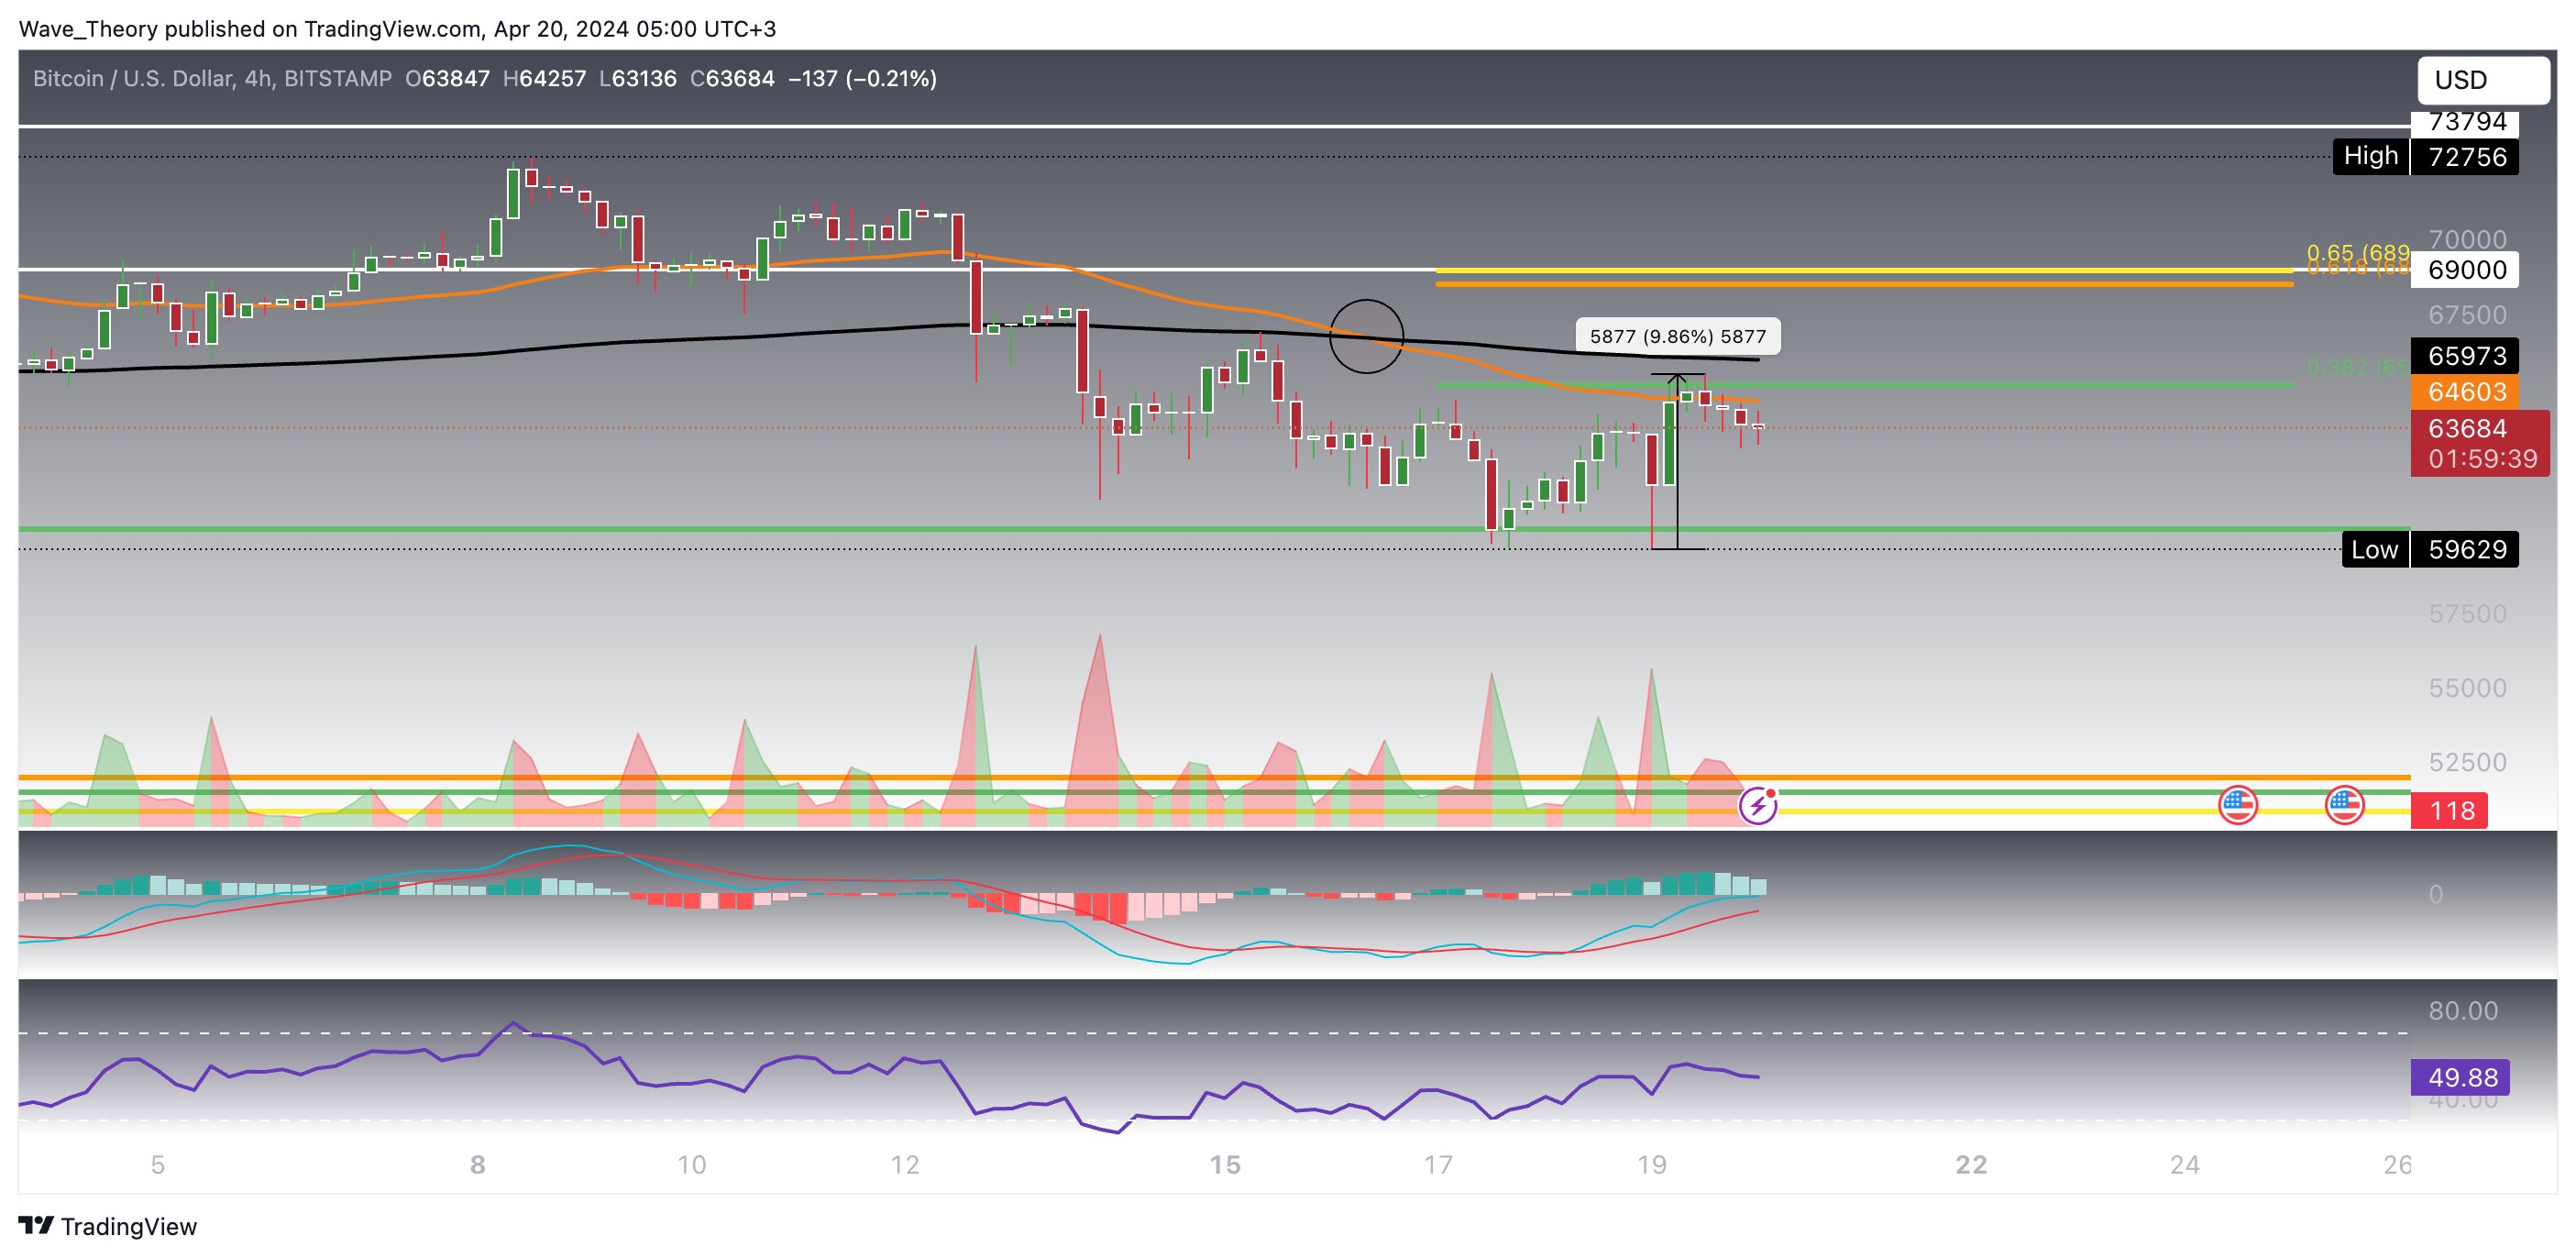
The 4-Hour Chart Indicates A Short-Term Confirmation Of A Bearish Trend

In summary, while the short-term 4H-chart suggests a bearish configuration with a death cross on the EMAs, the broader bullish setup remains intact, supported by multiple technical indicators. The market’s response to these key Fibonacci levels and EMAs in the coming days will be critical in determining whether Bitcoin resumes its uptrend or deepens its correction. Monitoring these levels closely will provide valuable insights into Bitcoin’s near-term directional bias.

Bitcoin Price Analysis Tradingview

Check out our free forex signals
Follow the top economic events on FX Leaders economic calendar
Trade better, discover more Forex Trading Strategies
ABOUT THE AUTHOR See More
contact.me.konstantin@gmail.com
Konstantin Kaiser
Financial Writer and Market Analyst
Konstantin Kaiser comes from a data science background and has significant experience in quantitative trading. His interest in technology took a notable turn in 2013 when he discovered Bitcoin and was instantly intrigued by the potential of this disruptive technology.
Related Articles
Top
FX
Crypto
Commodities
Indices
Start Trading