Ethereum Dropping Like A Rock, Next Stop $2,600?
Ethereum is under immense selling pressure, dropping towards $3,000. This is despite the launch of spot ETH ETFs in Hong Kong

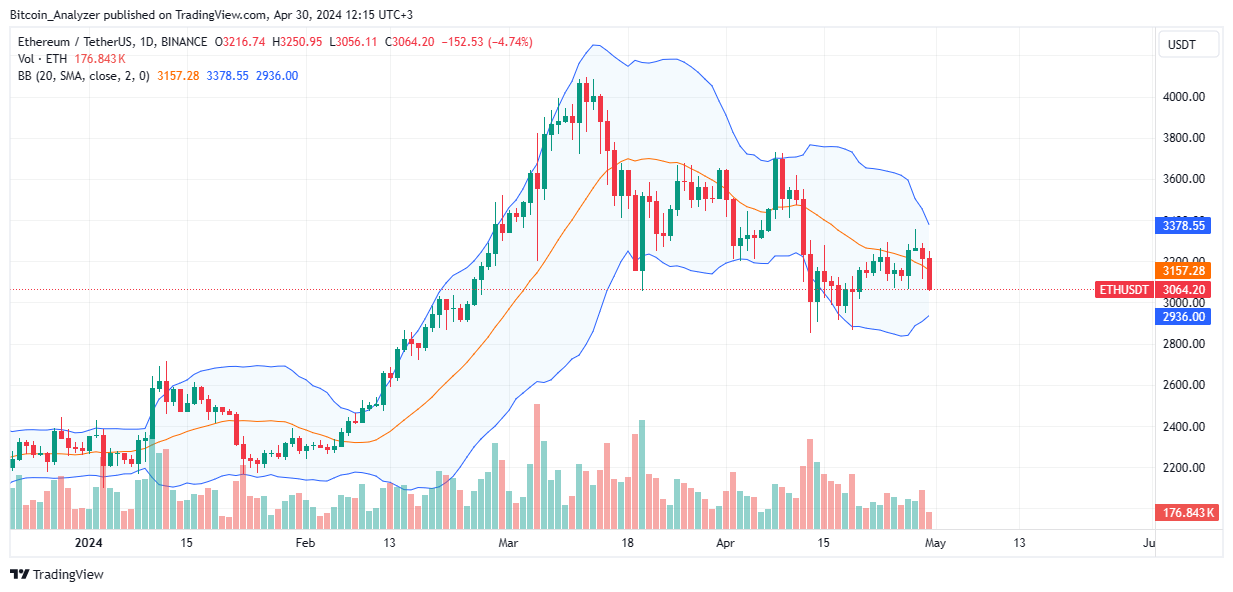
Ethereum is rapidly declining, as seen in the daily chart. The strengthening of the USD is a significant factor that ETH holders should be mindful of, as it is likely to affect them. The current sell-off is dampening hopes of the second most valuable coin reclaiming $3,300. This crucial liquidation level, as indicated by the candlestick arrangement, is a line that bulls must decisively break for any chance of rallying to $3,700 and $4,090.
As Ethereum approaches $3,000, the coin is down roughly 3% in the last day and week. Overall, sellers are in a commanding position. The sell-off has also led to an increase in trading volume. In the past day alone, the average trading volume stood at $13.7 billion, up 3%. This number may continue rising as sellers double down, unloading the asset and further fueling the slide.
The following Ethereum news events could prop up prices in the days ahead:
- Technical analysts note that ETH/USD is moving inside a descending channel. Considering the positive correlation between Bitcoin and Ethereum, if the former dumps below $60,000, it is likely that ETH will follow suit. As predicted, the coin might fall to as low as $2,600.
- As spot Ethereum ETFs launch in Hong Kong, experts are now examining whether they will have the same impact as spot Bitcoin ETFs. Following the release of spot Bitcoin ETFs in the United States, prices temporarily fell before rallying to all-time highs before halving.
Ethereum Price Analysis
As aforementioned, the path of least resistance is southwards.
Therefore, from this arrangement, sellers can search for entries on every retracement towards $3,300. Their immediate targets, aligning with the bear breakout formation of April 13, would be April lows of around $2,800.
If sellers press on, the next feasible target would be $2,600 and the psychological $2,000 level.
On the other hand, if bulls manage to shake off the current selling pressure, prices must comprehensively break above $3,300. This surge must be accompanied by rising trading volumes, ideally exceeding those of April 13.
- Check out our free forex signals
- Follow the top economic events on FX Leaders economic calendar
- Trade better, discover more Forex Trading Strategies
- Open a FREE Trading Account
- Read our latest reviews on: Avatrade, Exness, HFM and XM
Related Articles


Sidebar rates
Related Posts
