Gold
Gold Price Update: Minor Gain Amid Resistance, Eyes on $2,313 Pivot Point
Arslan Butt•Wednesday, May 1, 2024•2 min read
Gold prices experienced a decline in the Asian trading session on Wednesday, with spot gold reaching $2,285.19 an ounce, following a notable retreat from the previous day’s positions above the $2,300 mark. This downtrend reflects broader market anticipations of a potentially hawkish stance from the Federal Reserve.

Federal Reserve Meeting: A Crucial Juncture for Gold Investors
| Broker | Review | Regulators | Min Deposit | Website | |
|---|---|---|---|---|---|
| 🥇 |  | Read Review | ASIC, FSA, CBI, BVI, FSCA, FRSA, CySEC, ISA, JFSA | USD 100 | Visit Broker >> |
| 🥈 |  | Read Review | FMA, FSA | USD 50 | Visit Broker >> |
| 🥉 |  | Read Review | FSCA, CySEC, DFSA, FSA, CMA | USD 0 | Visit Broker >> |
| 4 |  | Read Review | CySEC, MISA, FSCA | USD 5 | Visit Broker >> |
| 5 |  | Read Review | FCA, CySEC, FSCA, SCB | USD 100 | Visit Broker >> |
| 6 |  | Read Review | FCA, FINMA, FSA, ASIC | USD 0 | Visit Broker >> |
| 7 |  | Read Review | CySEC, FCA, FSA, FSCA, Labuan FSA | USD 100 | Visit Broker >> |
| 8 |  | Read Review | CBCS, CySEC, FCA, FSA, FSC, FSCA, CMA | USD 10 | Visit Broker >> |
| 9 |  | Read Review | ASIC, CySEC, FSCA, CMA | USD 100 | Visit Broker >> |
| 10 |  | Read Review | IFSC, FSCA, ASIC, CySEC | USD 1 | Visit Broker >> |
The focus of global markets is firmly on the Federal Reserve’s upcoming policy announcement. Expectations are set for the central bank to hold interest rates steady, which could reinforce the higher-for-longer interest rate environment.
This scenario is typically negative for gold, as it enhances the yield on alternative investments.
Strong Economic Indicators Bolster Rate Hike Prospects
Contributing to the bearish outlook for gold are recent robust US economic figures, including an unexpected rise in the employment cost index, suggesting sustained inflationary pressures. These developments have led investors to adjust their expectations for an earlier rate easing, with predictions for a rate cut pushed to September at the earliest.
Global Tensions and Gold Demand
Despite these pressures, gold’s role as a safe-haven asset could be underscored by ongoing global geopolitical tensions and market volatility. Notably, China’s strategic gold acquisitions might signal broader economic defence measures, potentially influencing global gold markets.

As gold navigates through economic data releases and central bank policies, its role as a financial safe haven will be tested against the backdrop of rising yields and a strong dollar.
Gold Price Edges Up A Close Look at Key Technical Levels
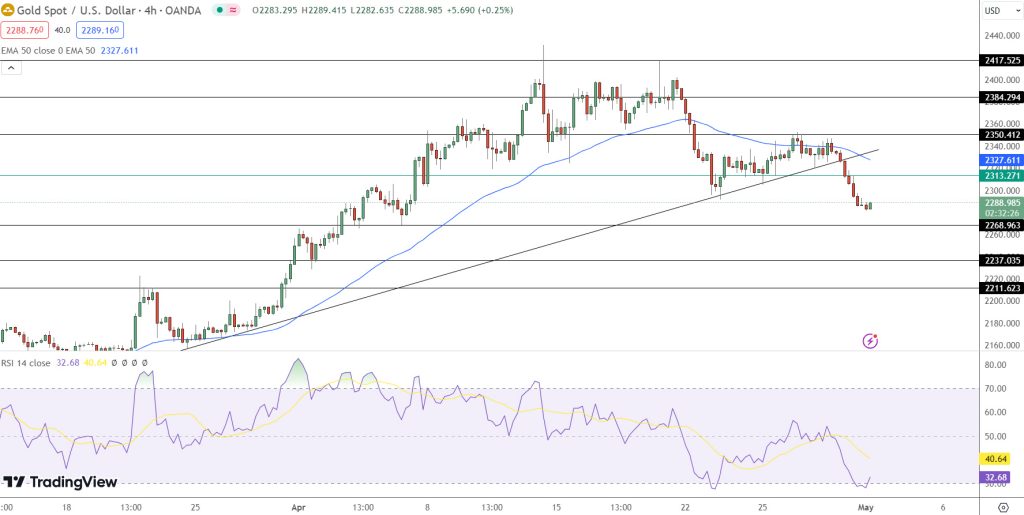
Today, GOLD slightly increased to $2,288, marking a 0.08% rise. Currently positioned just below the crucial level of $2,313.75, the metal faces several resistance hurdles.
Immediate resistance lies at $2,352.13, with further barriers at $2,378.36 and $2,417.99, challenging any potential gains. Conversely, support is found at $2,273.69, with additional protective levels at $2,243.84 and $2,212.02, which could prevent further price drops.
- 50-Day and 200-Day EMAs set at $2,318.95 and $2,323.90, indicate a tight trading band.
- A breakout below $2,315 could signal more declines, impacting the gold market outlook.
Check out our free forex signals
Follow the top economic events on FX Leaders economic calendar
Trade better, discover more Forex Trading Strategies
Arslan Butt
Index & Commodity Analyst
Arslan Butt serves as the Lead Commodities and Indices Analyst, bringing a wealth of expertise to the field. With an MBA in Behavioral Finance and active progress towards a Ph.D., Arslan possesses a deep understanding of market dynamics.His professional journey includes a significant role as a senior analyst at a leading brokerage firm, complementing his extensive experience as a market analyst and day trader. Adept in educating others, Arslan has a commendable track record as an instructor and public speaker.His incisive analyses, particularly within the realms of cryptocurrency and forex markets, are showcased across esteemed financial publications such as ForexCrunch, InsideBitcoins, and EconomyWatch, solidifying his reputation in the financial community.
Related Articles
Top
FX
Crypto
Commodities
Indices
Start Trading
🏆 7 Best Forex Brokers
| Broker | Website | |
|---|---|---|
| 🥇 |  | Visit Broker >> |
| 🥈 |  | Visit Broker >> |
| 🥉 |  | Visit Broker >> |
| 4 |  | Visit Broker >> |
| 5 |  | Visit Broker >> |
| 6 |  | Visit Broker >> |
| 7 |  | Visit Broker >> |


