Silver Price Forecast: XAG/USD at $28.55 Amid Strong US Dollar and Upcoming US CPI Data
The price of silver (XAG/USD) continues its downward trend, trading around $28.55 with an intraday low of $28.43.
The price of silver (XAG/USD) continues its downward trend, trading around $28.55 with an intraday low of $28.43.
This decline is driven by hawkish statements from Federal Reserve officials and robust US Producer Price Index (PPI) data. April’s PPI rose by 2.2% year-over-year, with Core PPI climbing by 2.4%, indicating increasing inflationary pressures and expectations of tighter monetary policy from the Federal Reserve.
Stronger US Dollar; US Inflation Ahead
The strengthening US dollar negatively impacts silver prices, supported by the Federal Reserve’s firm stance on interest rates and positive economic data. Fed Chair Jerome Powell emphasized that inflation is decreasing slower than expected, suggesting that interest rates might remain high for an extended period. Kansas City Fed President Jeffrey Schmid also highlighted that inflation remains too high, signaling potential further actions by the Fed.
Looking forward, the Consumer Price Index (CPI) is expected to show slight moderation in April, with headline CPI projected to decrease to 3.4% and Core CPI to 3.6%. Additionally, a decline in April’s US Retail Sales is anticipated. Financial markets are starting to price in a possible Fed rate cut by September 2024. This anticipation of continued high interest rates to curb inflation exerts downward pressure on silver prices.
Ongoing Gaza Conflict
Geopolitical tensions between Israeli forces and Palestinian armed groups in Gaza persist, resulting in significant casualties and widespread destruction. Some Israeli officials support reoccupying Gaza amid rising tensions. This ongoing conflict contributes to global market uncertainty, potentially driving investors toward safe-haven assets like silver, which could increase its price.
Silver Technical Outlook
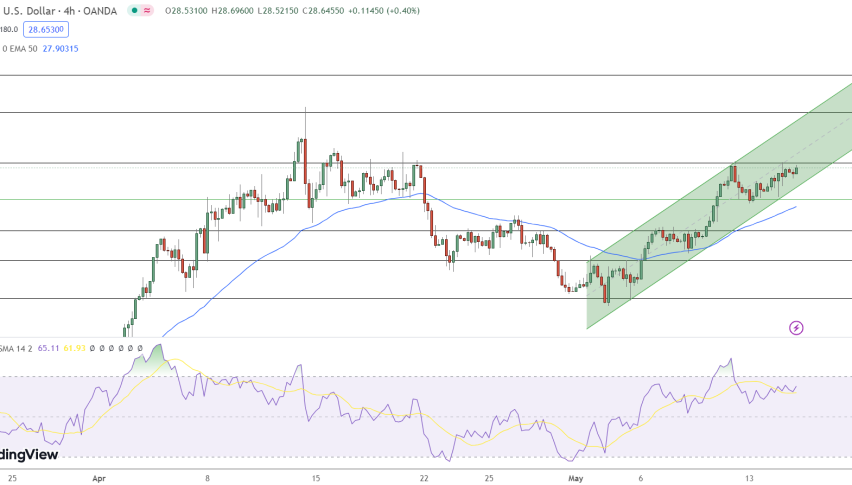
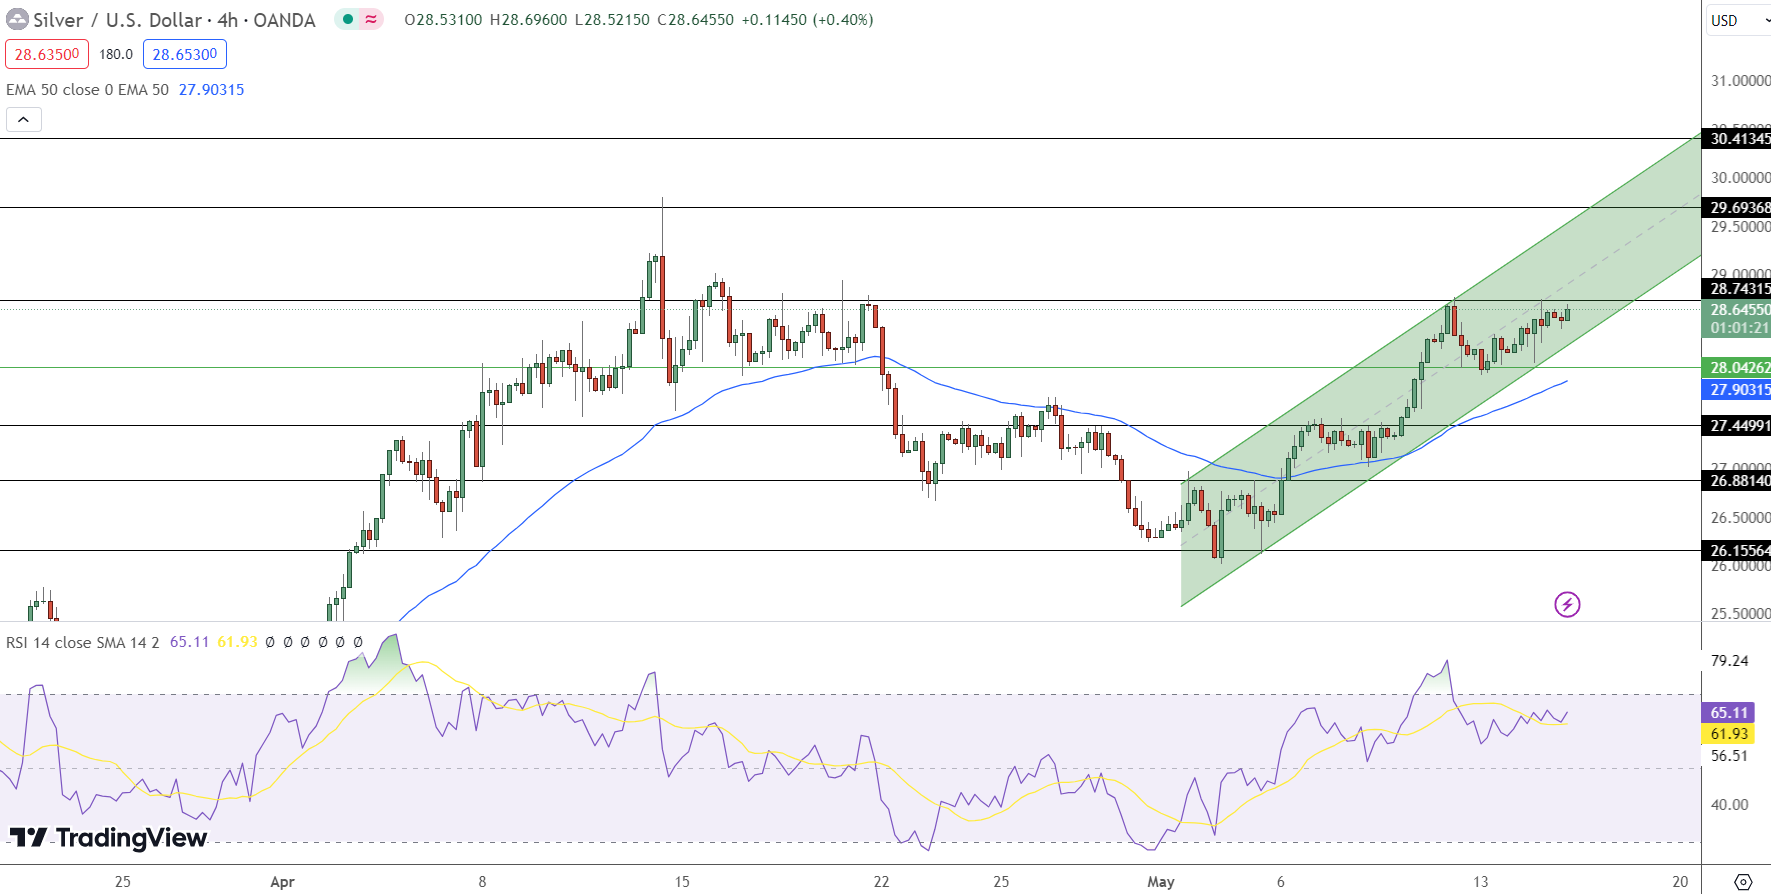
Silver (XAG/USD) is currently trading at $28.55, down 0.23%. The 4-hour chart shows a pivot point at $28.37, serving as a critical level to monitor. Immediate resistance levels are at $28.79, $29.24, and $29.64. On the downside, immediate support is at $27.96, followed by $27.53 and $27.10.
Technical indicators suggest a bullish trend. The 50-day EMA is at $27.90, while the 200-day EMA stands at $27.07, both supporting upward momentum. Additionally, an upward channel is reinforcing the bullish trend, especially above the $28.35 level.
- Check out our free forex signals
- Follow the top economic events on FX Leaders economic calendar
- Trade better, discover more Forex Trading Strategies
- Open a FREE Trading Account
- Read our latest reviews on: Avatrade, Exness, HFM and XM
Related Articles


Sidebar rates
Related Posts
