Japan Trade Balance Deficit Widens and Bond Auction Yields Rise – Weighing on NIKKEI
The latest data for Japan’s Trade Balance showed it widened from a surplus last month of ¥366.5 billion to a deficit of ¥462.5 billion
The latest data for Japan’s Trade Balance showed it widened from a surplus last month of ¥366.5 billion to a deficit of ¥462.5 billion.
The numbers shows a decline competitivity from Japan, although some sectors showed growth in their exports.
Japan’s exports to China and Asia grew by 9.6% and 9.7% respectively, led by demand for chip making machines and cars. The 40-year bond auction showed a rise in the average yield, from 1.905% last month to 2.27%.
The market has been concerned that despite the absence of a rate hike, the central bank would use bond yields to strengthen the yen. That path would seem likely, as the speculated BoJ interventions in the forex market do not seem to have achieved the desired effect.
The effect of higher bond yields would be comparable to having higher interest rates. Even if banks can finance corporates cheaply, investors will find holding bonds with higher yields more rewarding.
Investors diverting cash to bonds would mean less cash going into stocks. So, while the BoJ may effectively push the yen higher they may also cause a drop in the broader stock market price.
Technical View
The day for the NIKKEI225 below shows a market that is still in a correction phase. The index has been trading on the lower part of the Ichimoku cloud, or no-man’s land, for the past 22 sessions. This price area denotes uncertainty at the least.
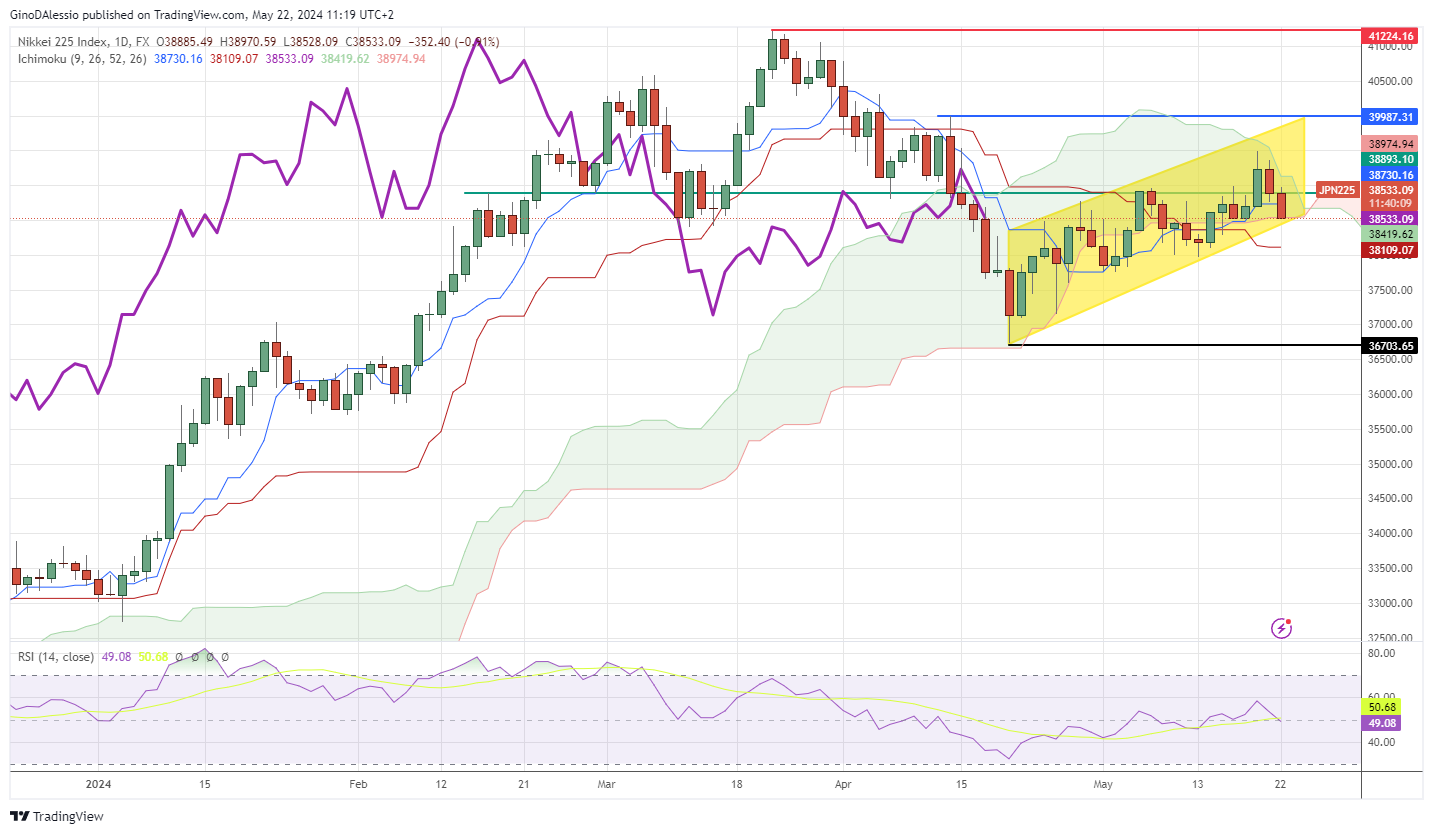
The candle pattern (yellow area) showing an upward sloping rectangle, is typically a consolidation formation that leads to further downward price action. The previous two candles failed to break above the cloud. And today’s candle looks set to break below it.
A break below the cloud would only be complete once the lagging line (purple) also breaks below the cloud. A break below the cloud would find support on the recent low of 36703 (black line).
- Check out our free forex signals
- Follow the top economic events on FX Leaders economic calendar
- Trade better, discover more Forex Trading Strategies
- Open a FREE Trading Account
- Read our latest reviews on: Avatrade, Exness, HFM and XM
Related Articles


Sidebar rates
Related Posts
